This notebook contains the code examples from Section 5.2 Bayesian inference computations from the No Bullshit Guide to Statistics.
See also:
Notebook setup
# Ensure required Python modules are installed
%pip install --quiet numpy scipy seaborn statsmodels bambi==0.15.0 pymc==5.23.0 ministats
Note: you may need to restart the kernel to use updated packages.
# Load Python modules
import numpy as np
import pandas as pd
import seaborn as sns
import matplotlib.pyplot as plt
# Figures setup
plt.clf() # needed otherwise `sns.set_theme` doesn't work
sns.set_theme(
context="paper",
style="whitegrid",
palette="colorblind",
rc={"font.family": "serif",
"font.serif": ["Palatino", "DejaVu Serif", "serif"],
"figure.figsize": (5,3)},
)
%config InlineBackend.figure_format = "retina"<Figure size 640x480 with 0 Axes># Simple float __repr__
if int(np.__version__.split(".")[0]) >= 2:
np.set_printoptions(legacy='1.25')Definitions
TODO
Posterior inference using MCMC estimation
TODO: point-form definitions
Bayesian inference using Bambi
TODO: mention Bambi classes
import bambi as bmbprint(bmb.Prior.__doc__)Abstract specification of a term prior
Parameters
----------
name : str
Name of prior distribution. Must be the name of a PyMC distribution
(e.g., `"Normal"`, `"Bernoulli"`, etc.)
auto_scale: bool
Whether to adjust the parameters of the prior or use them as passed. Default to `True`.
kwargs : dict
Optional keywords specifying the parameters of the named distribution.
dist : pymc.distributions.distribution.DistributionMeta or callable
A callable that returns a valid PyMC distribution. The signature must contain `name`,
`dims`, and `shape`, as well as its own keyworded arguments.
print("\n".join(bmb.Model.__doc__.splitlines()[0:27]))Specification of model class
Parameters
----------
formula : str or bambi.formula.Formula
A model description written using the formula syntax from the `formulae` library.
data : pandas.DataFrame
A pandas dataframe containing the data on which the model will be fit, with column
names matching variables defined in the formula.
family : str or bambi.families.Family
A specification of the model family (analogous to the family object in R). Either
a string, or an instance of class `bambi.families.Family`. If a string is passed, a
family with the corresponding name must be defined in the defaults loaded at `Model`
initialization. Valid pre-defined families are `"bernoulli"`, `"beta"`,
`"binomial"`, `"categorical"`, `"gamma"`, `"gaussian"`, `"negativebinomial"`,
`"poisson"`, `"t"`, and `"wald"`. Defaults to `"gaussian"`.
priors : dict
Optional specification of priors for one or more terms. A dictionary where the keys are
the names of terms in the model, "common," or "group_specific" and the values are
instances of class `Prior`. If priors are unset, uses automatic priors inspired by
the R rstanarm library.
link : str or Dict[str, str]
The name of the link function to use. Valid names are `"cloglog"`, `"identity"`,
`"inverse_squared"`, `"inverse"`, `"log"`, `"logit"`, `"probit"`, and
`"softmax"`. Not all the link functions can be used with all the families.
If a dictionary, keys are the names of the target parameters and the values are the names
of the link functions.
Example 1: estimating the probability of a bias of a coin
Let’s revisit the biased coin example from Section 5.1, where we want to estimate the probability the coin turns up heads.
Data
We have a sample that contains observations (coin tosses) from the coin.
The outcome 1 corresponds to heads,
while the outcome 0 corresponds to tails.
We package the data as the ctoss column of a new data frame ctosses.
ctosses = [1,1,0,0,1,0,1,1,1,1,1,0,1,1,0,0,0,1,1,1,
           1,1,1,1,1,1,1,0,1,1,1,1,1,1,1,1,0,0,1,0,
           0,1,0,1,0,1,0,1,1,0]
ctosses = pd.DataFrame({"ctoss":ctosses})
ctosses.head(3)The proportion of heads outcomes is:
ctosses["ctoss"].mean()0.68import bambi as bmb
bmb.Prior("Uniform", lower=0, upper=1)Uniform(lower: 0.0, upper: 1.0)priors1 = {
"Intercept": bmb.Prior("Uniform", lower=0, upper=1)
}
mod1 = bmb.Model(formula="ctoss ~ 1",
family="bernoulli",
link="identity",
priors=priors1,
data=ctosses)
mod1.set_alias({"Intercept": "P"})
mod1 Formula: ctoss ~ 1
Family: bernoulli
Link: p = identity
Observations: 50
Priors:
target = p
Common-level effects
Intercept ~ Uniform(lower: 0.0, upper: 1.0)mod1.build()
mod1.graph()# mod1.backend.modelFitting the model
idata1 = mod1.fit(random_seed=42)Modeling the probability that ctoss==1
Initializing NUTS using jitter+adapt_diag...
Multiprocess sampling (4 chains in 4 jobs)
NUTS: [P]
Sampling 4 chains for 1_000 tune and 1_000 draw iterations (4_000 + 4_000 draws total) took 1 seconds.
Exploring InferenceData objects
idata1type(idata1)arviz.data.inference_data.InferenceDataidata1.groups()['posterior', 'sample_stats', 'observed_data']type(idata1["posterior"])xarray.core.dataset.Datasetlist(idata1["posterior"].coords)['chain', 'draw']list(idata1["posterior"].data_vars)['P']type(idata1["posterior"]["P"])xarray.core.dataarray.DataArrayidata1["posterior"]["P"]type(idata1["posterior"]["P"].values)numpy.ndarrayidata1["posterior"]["P"].values.round(3)array([[0.761, 0.569, 0.776, ..., 0.708, 0.629, 0.708],
[0.689, 0.732, 0.676, ..., 0.602, 0.594, 0.663],
[0.697, 0.674, 0.658, ..., 0.675, 0.675, 0.642],
[0.72 , 0.754, 0.77 , ..., 0.706, 0.739, 0.646]])idata1["posterior"]["P"].values.shape(4, 1000)Extracting the samples from the posterior
postP = idata1["posterior"]["P"].values.flatten()
postP
array([0.76122756, 0.56861221, 0.77616961, ..., 0.70605793, 0.73880719,
0.64569808])Visualize the posterior
Histogram
ax = sns.histplot(x=postP, stat="density")
ax.set_xlabel("$p$")
ax.set_ylabel("$f_{P|\\mathbf{c}}$");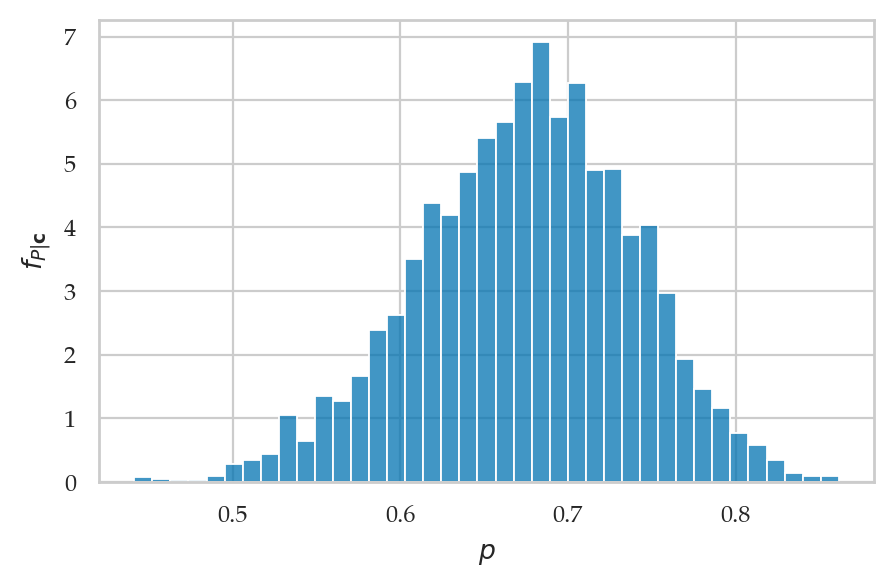
Kernel density plot
ax = sns.kdeplot(x=postP)
ax.set_xlabel("$p$")
ax.set_ylabel("$f_{P|\\mathbf{c}}$");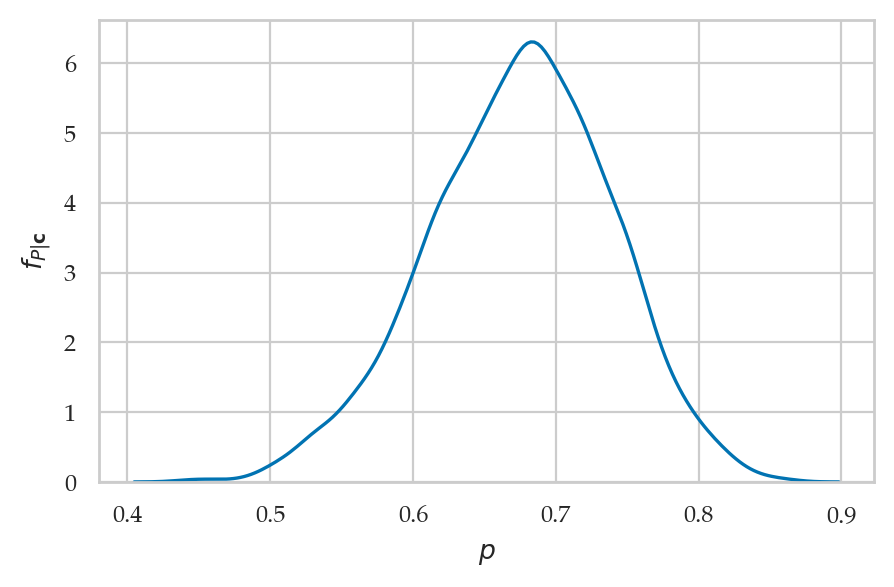
Summarize the posterior
len(postP)4000Posterior mean
np.mean(postP)0.6747512974497554Posterior standard deviation
np.std(postP)0.06413160885365309Posterior median
np.median(postP)0.6780571467155877Posterior quartiles
np.quantile(postP, [0.25, 0.5, 0.75])array([0.63207241, 0.67805715, 0.71976479])Posterior percentiles
np.percentile(postP, [3, 97])array([0.54664801, 0.78923245])Posterior mode
from ministats import mode_from_samples
mode_from_samples(postP)0.6833825973512753Credible interval
from ministats import hdi_from_samples
hdi_from_samples(postP, hdi_prob=0.9)
[0.5733806152569917, 0.7841482011374427]Example 2: estimating the IQ score
Let’s return to the investigation of the smart drug effects on IQ scores.
Data
We have collected data from 30 individuals who took the smart drug,
which we have packaged into the iq column of the data frame iqs.
iqs = [ 82.6, 105.5,  96.7,  84.0, 127.2,  98.8,  94.3,
       122.1,  86.8,  86.1, 107.9, 118.9, 116.5, 101.0,
        91.0, 130.0, 155.7, 120.8, 107.9, 117.1, 100.1,
       108.2,  99.8, 103.6, 108.1, 110.3, 101.8, 131.7,
       103.8, 116.4]
iqs = pd.DataFrame({"iq":iqs})
iqs["iq"].mean()107.82333333333334Model
We will use the following Bayesian model:
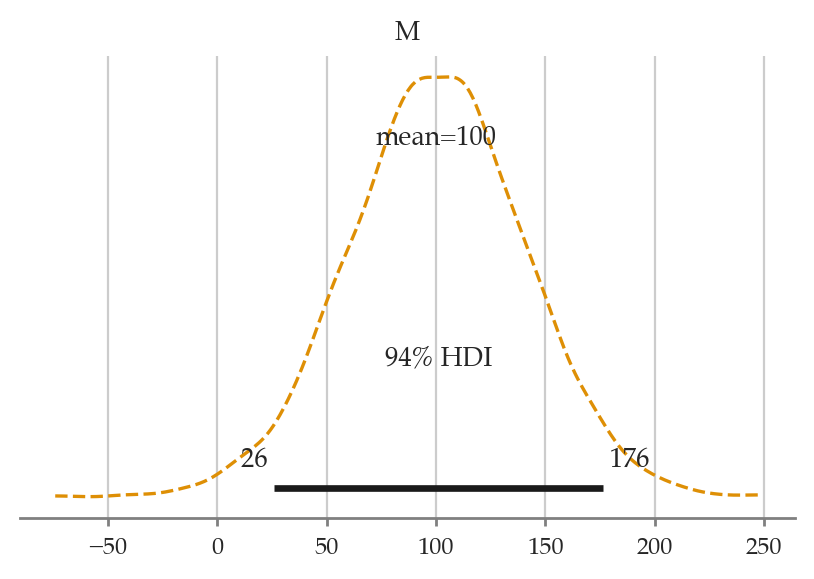
We place a broad prior on the mean parameter , by choosing a large value for the standard deviation . We assume the IQ scores come from a population with standard deviation .
import bambi as bmb

priors2 = {
    "Intercept": bmb.Prior("Normal", mu=100, sigma=40),
    "sigma": 15,
}

mod2 = bmb.Model(formula="iq ~ 1",
                 family="gaussian",
                 link="identity",
                 priors=priors2,
                 data=iqs)

mod2.set_alias({"Intercept": "M"})
mod2
Formula: iq ~ 1
Family: gaussian
Link: mu = identity
Observations: 30
Priors:
target = mu
Common-level effects
Intercept ~ Normal(mu: 100.0, sigma: 40.0)
Auxiliary parameters
sigma ~ 15mod2.build()
mod2.graph()Fitting the model
This time we’ll generate samples from each chain.
idata2 = mod2.fit(draws=2000, random_seed=42)Initializing NUTS using jitter+adapt_diag...
Multiprocess sampling (4 chains in 4 jobs)
NUTS: [M]
Sampling 4 chains for 1_000 tune and 2_000 draw iterations (4_000 + 8_000 draws total) took 1 seconds.
Extract the samples from the posterior
postM = idata2["posterior"]["M"].values.flatten()
len(postM)8000postMarray([111.84188777, 111.84188777, 110.69558723, ..., 105.38269922,
106.5084091 , 107.49061702])Visualize the posterior
Histogram
ax = sns.histplot(x=postM, stat="density")
ax.set_xlabel("$\\mu$")
ax.set_ylabel("$f_{M|\\mathbf{x}}$");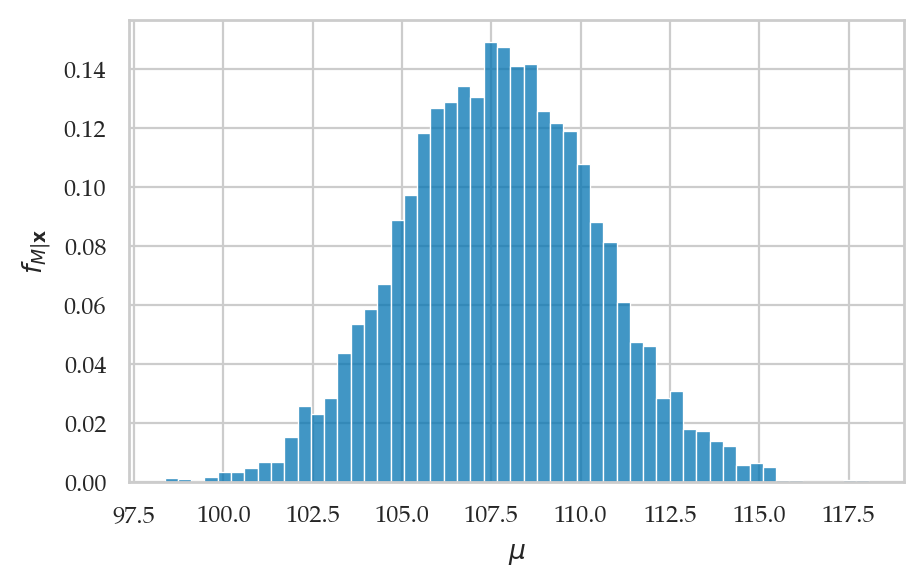
Kernel density plot
ax = sns.kdeplot(x=postM)
ax.set_xlabel("$\\mu$")
ax.set_ylabel("$f_{M|\\mathbf{x}}$");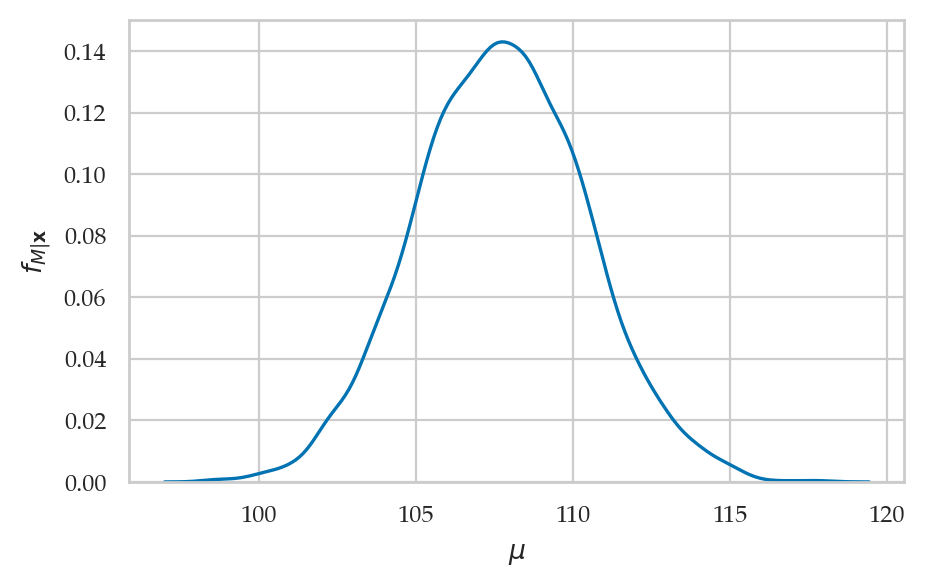
Summarize the posterior
Posterior mean
np.mean(postM)107.72704847150636Posterior standard deviation
np.std(postM)2.7150176274941304Posterior median
np.median(postM)107.71902676335739Posterior quartiles
np.quantile(postM, [0.25, 0.5, 0.75])array([105.87041865, 107.71902676, 109.59653928])Posterior percentiles
np.percentile(postM, [3, 97])array([102.60648664, 112.88591885])Posterior mode
from ministats import mode_from_samples
mode_from_samples(postM)107.7582939445229Credible interval
from ministats import hdi_from_samples
hdi_from_samples(postM, hdi_prob=0.9)
[103.25275390621668, 112.12840034704796]Visualizing and interpreting posteriors
import arviz as azExample 1 continued: inferences about the biased coin
Extracting samples (CUTTABLE)
For the purpose of our data analysis,
we don’t care about the chain and draw information
and are only interested in in the variable P,
which are the actual samples from the posterior.
The easiest way to extract the samples from the posterior
is to use the ArviZ helper method az.extract shown below.
postP = az.extract(idata1, var_names="P").values
postP.round(3)
array([0.761, 0.569, 0.776, ..., 0.706, 0.739, 0.646])The call to the function az.extract selected the posterior group,
then selected the variable P within the posterior group.
/CUTTABLE
Summarizing the posterior
az.summary(idata1, kind="stats", hdi_prob=0.9)Plotting the posterior
az.plot_posterior(idata1, var_names="P", hdi_prob=0.9);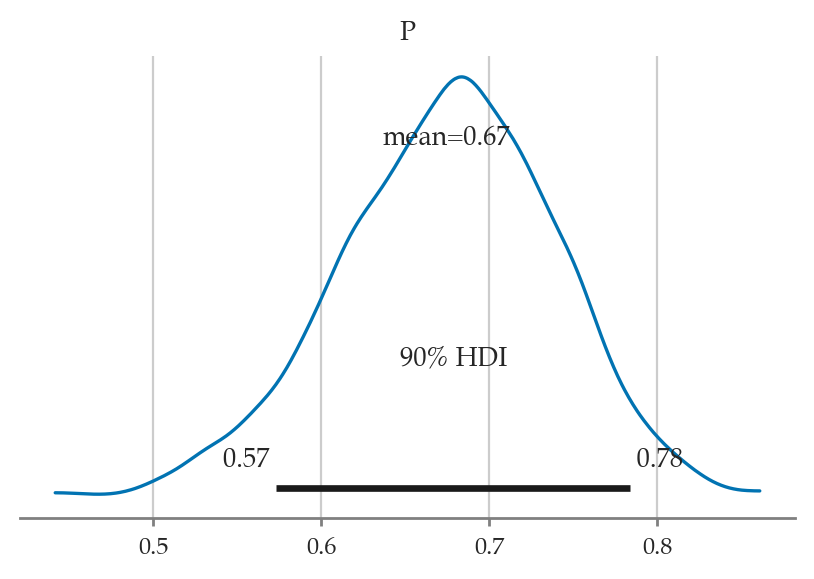
Options:
If multiple variables, you specify a list to
var_namesto select only certain variables to plotSet the option
point_estimateto"mode"or"median"Add the option
ropeto draw region of practical equivalence, e.g.,rope=[97,103]
az.plot_forest(idata1, hdi_prob=0.9, figsize=(6,2.2));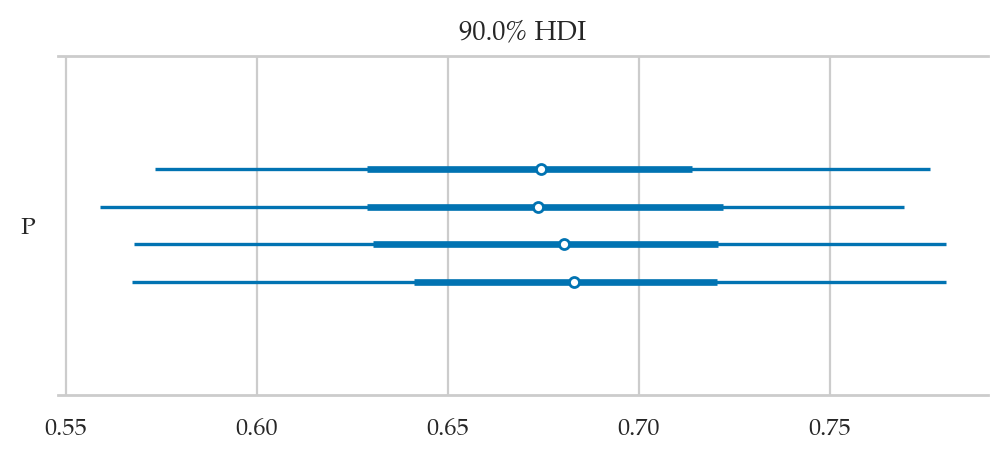
Example 2 continued: inferences about the population mean
Summarizing the posterior
az.summary(idata2, kind="stats", hdi_prob=0.9)Plotting the posterior
az.plot_posterior(idata2, var_names="M", hdi_prob=0.9);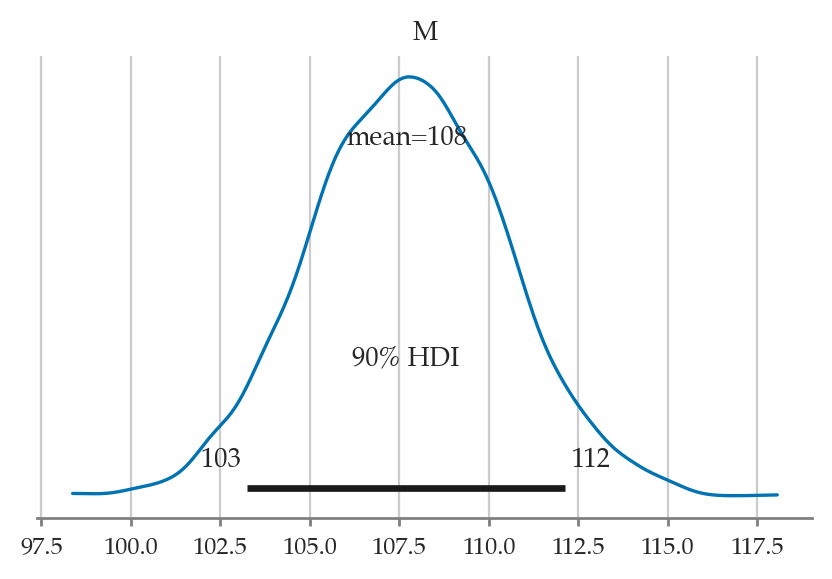
az.plot_posterior(idata2, var_names="M", hdi_prob=0.9, kind="hist", bins=70);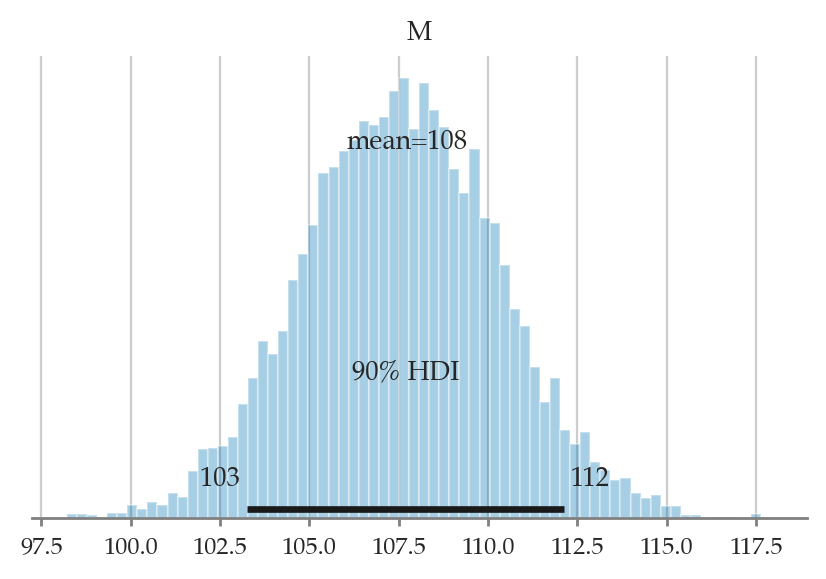
az.plot_forest(idata2, combined=True, hdi_prob=0.9, figsize=(6,0.6));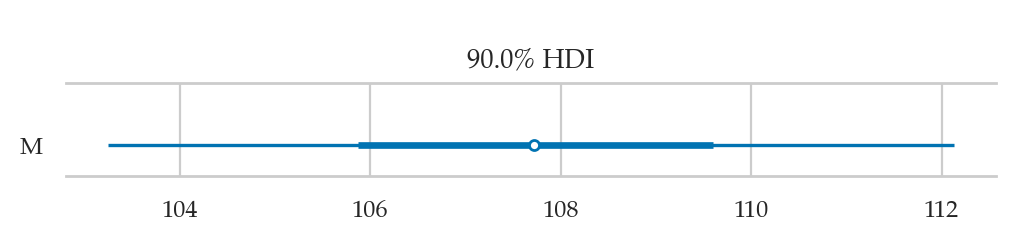
Hypothesis testing
az.plot_posterior(idata2, hdi_prob=0.95);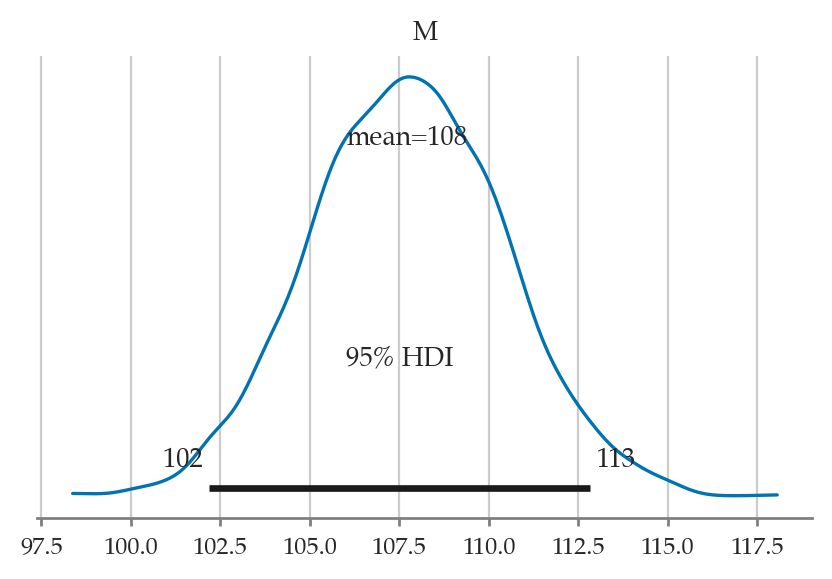
az.plot_posterior(idata2, hdi_prob="hide", rope=[97,103]);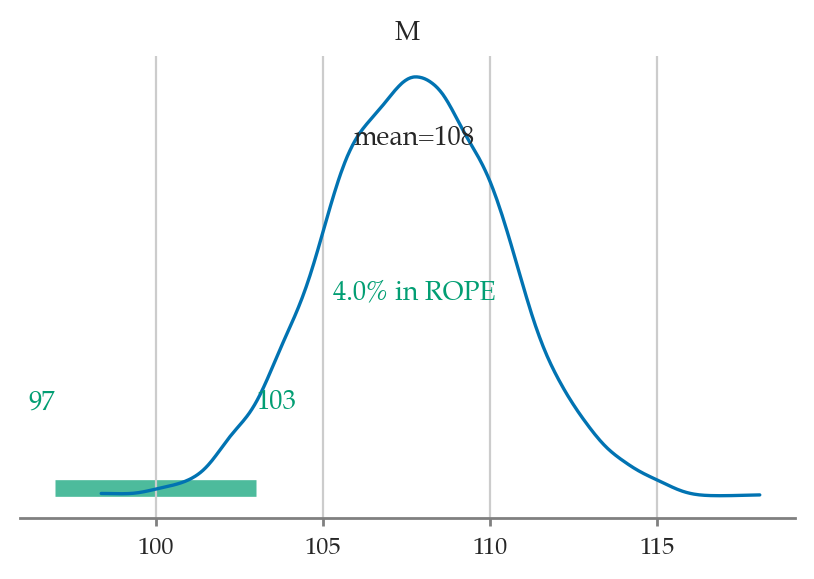
Explanations
Visualizing prior distributions
mod2.plot_priors(random_seed=43, color="C1", linestyle="dashed");Sampling: [M]
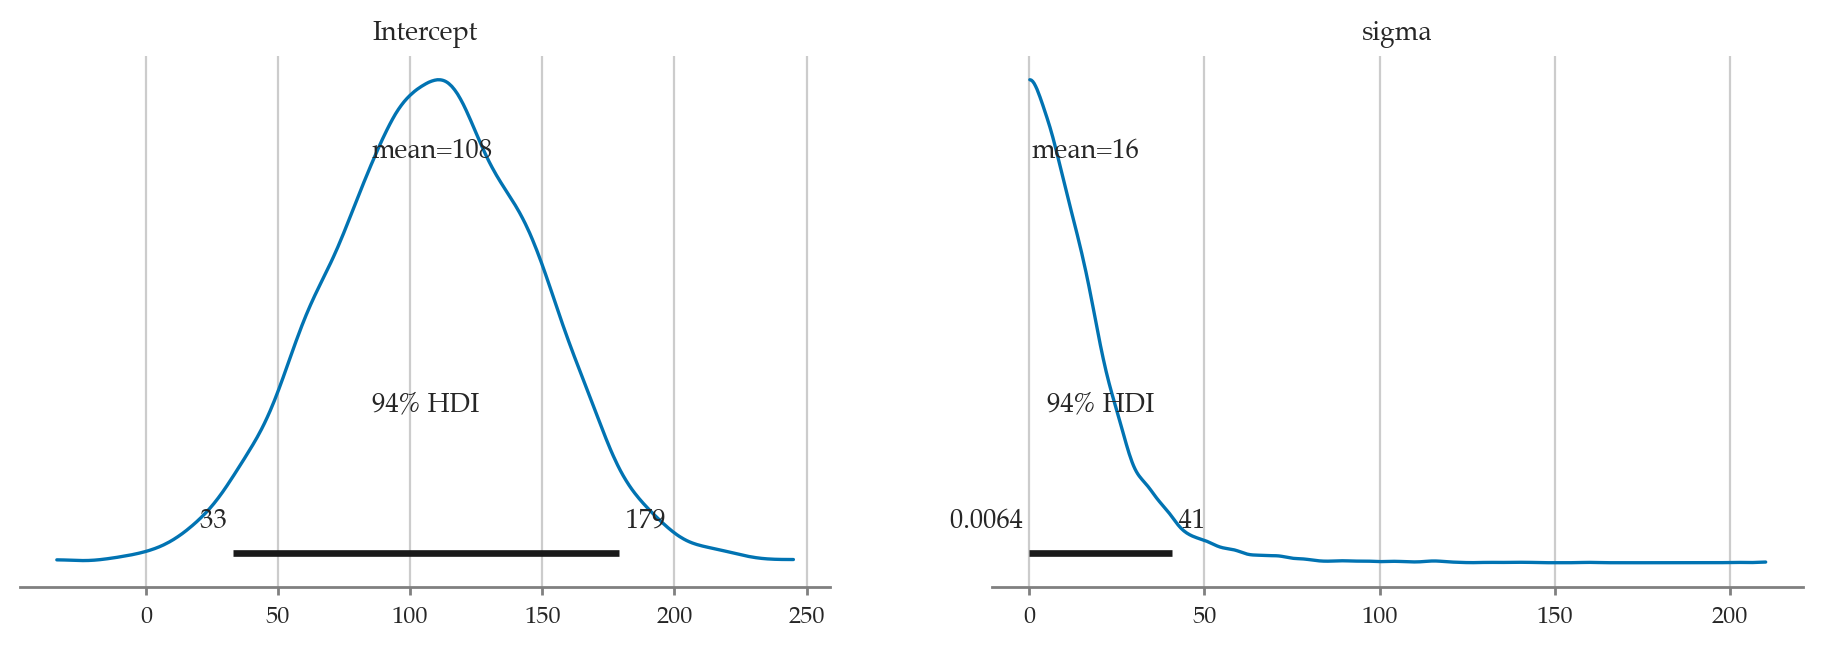
Bambi default priors
iqs["iq"].mean(), iqs["iq"].std(ddof=0), 2.5*iqs["iq"].std(ddof=0)(107.82333333333334, 15.812119472803834, 39.53029868200959)mod2d = bmb.Model("iq ~ 1", family="gaussian", data=iqs)
mod2d Formula: iq ~ 1
Family: gaussian
Link: mu = identity
Observations: 30
Priors:
target = mu
Common-level effects
Intercept ~ Normal(mu: 107.8233, sigma: 39.5303)
Auxiliary parameters
sigma ~ HalfStudentT(nu: 4.0, sigma: 15.8121)mod2d.build()
mod2d.plot_priors();Sampling: [Intercept, sigma]
More about inference data objects
idata1type(idata1)arviz.data.inference_data.InferenceDataidata1.groups()['posterior', 'sample_stats', 'observed_data']Groups are Dataset objects
post1 = idata1["posterior"]
type(post1)xarray.core.dataset.Dataset# post1post1.coordsCoordinates:
* chain (chain) int64 32B 0 1 2 3
* draw (draw) int64 8kB 0 1 2 3 4 5 6 7 ... 993 994 995 996 997 998 999post1.data_varsData variables:
P (chain, draw) float64 32kB 0.7612 0.5686 0.7762 ... 0.7388 0.6457Variables are DataArray objects
Ps = post1["P"] # == idata1["posterior"]["P"]
type(Ps)xarray.core.dataarray.DataArray# PsPs.shape(4, 1000)Ps.name'P'Ps.to_dataframe()Ps.valuesarray([[0.76122756, 0.56861221, 0.77616961, ..., 0.70772348, 0.62878475,
0.70789234],
[0.68937002, 0.73226925, 0.67623114, ..., 0.60182373, 0.59438488,
0.6632119 ],
[0.69674422, 0.67356423, 0.65844755, ..., 0.67517019, 0.67517019,
0.64238598],
[0.72020439, 0.75444132, 0.7699058 , ..., 0.70605793, 0.73880719,
0.64569808]])Ps.values.flatten()array([0.76122756, 0.56861221, 0.77616961, ..., 0.70605793, 0.73880719,
0.64569808])MCMC diagnostics
Trace plots
There are several Arviz plots we can use to check if the Markov Chain Monte Carlo chains were sampling from the posterior as expected, or ...
az.plot_trace(idata2);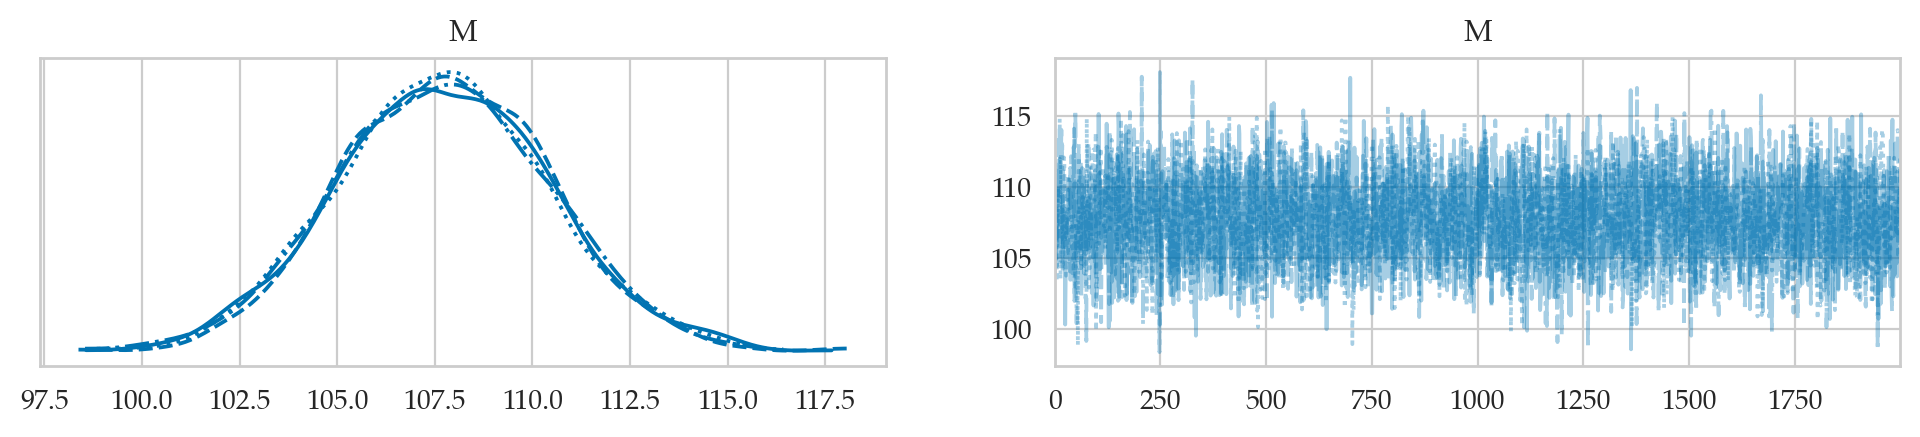
Rank plots
az.plot_rank(idata2);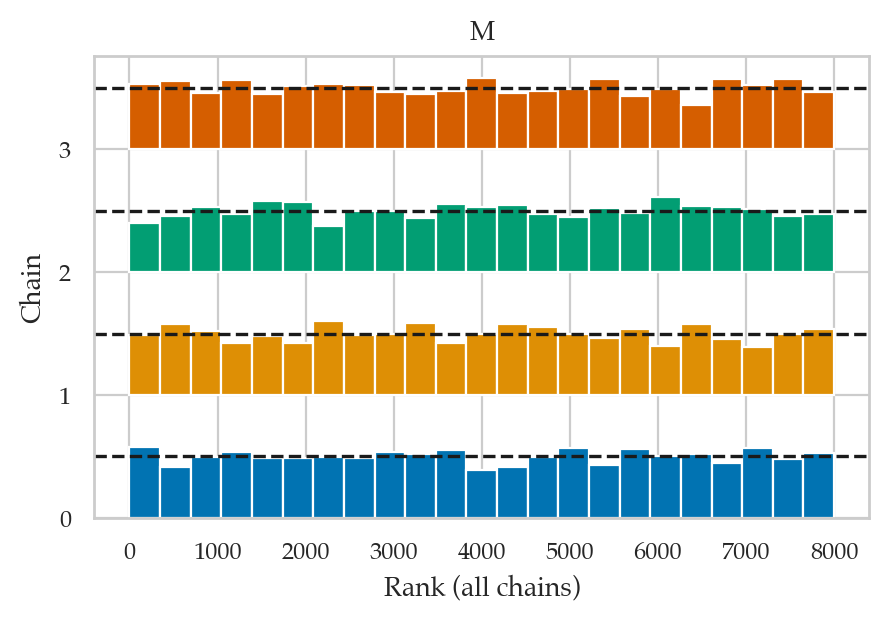
? Autocorrelation plot ?
https://
az.plot_autocorr(idata2, combined=True, max_lag=20);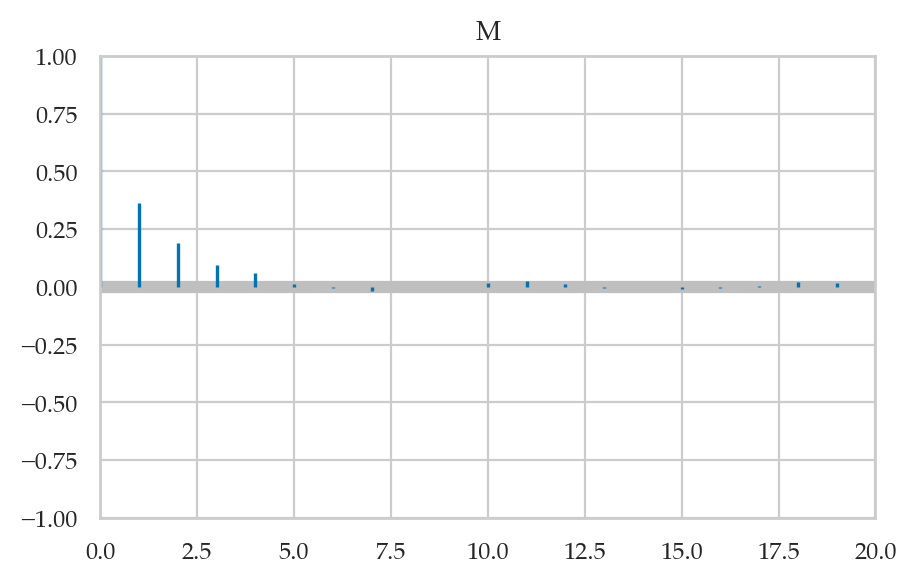
Diagnostic summary
az.summary(idata2, kind="stats")az.summary(idata2, kind="diagnostics")Prior predictive checks
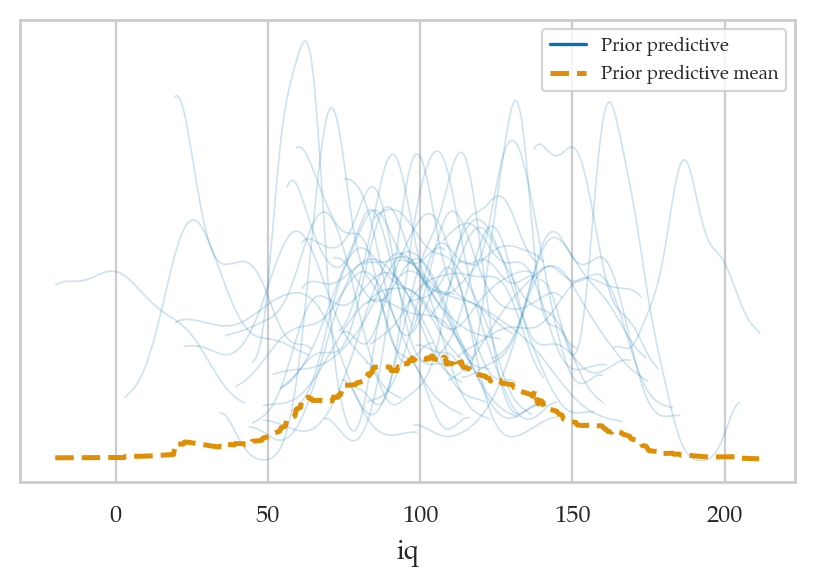
idata2_pri = mod2.prior_predictive(draws=50, random_seed=45)
az.plot_ppc(idata2_pri, group="prior");Sampling: [M, iq]
idata2_pri['prior']["mu"].shape(1, 50, 30)idata2_pri['prior_predictive']["iq"].shape(1, 50, 30)Posterior predictive checks
# Randomly sample 200 from all available posterior mean
# draws_subset = np.random.choice(idata2["posterior"]["draw"].values, 50, replace=False)
draws_subset = np.random.choice(2000, 50, replace=False)
idata2_rep = idata2.sel(draw=draws_subset)
mod2.predict(idata2_rep, kind="response")
az.plot_ppc(idata2_rep, group="posterior")<Axes: xlabel='iq'>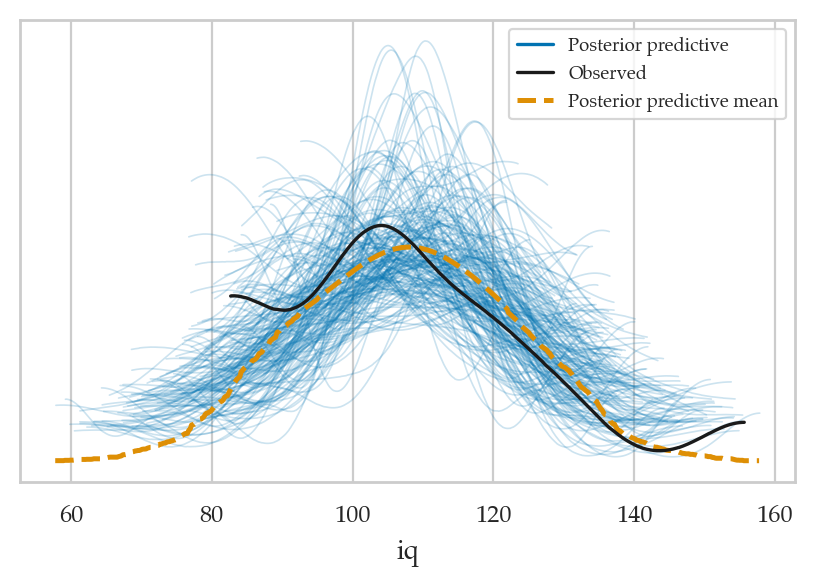
Fitting model to synthetic data
np.random.seed(46)
from scipy.stats import norm
fakeiqs = norm(loc=110, scale=15).rvs(30)
fakeiqs = pd.DataFrame({"iq":fakeiqs})
fakeiqs["iq"].mean()109.7132680142492#######################################################
mod2f = bmb.Model(formula="iq ~ 1", family="gaussian",
priors=priors2, data=fakeiqs)
mod2f.set_alias({"Intercept": "M"})
idata2f = mod2f.fit(random_seed=42)Initializing NUTS using jitter+adapt_diag...
Multiprocess sampling (4 chains in 4 jobs)
NUTS: [M]
Sampling 4 chains for 1_000 tune and 1_000 draw iterations (4_000 + 4_000 draws total) took 1 seconds.
az.summary(idata2f, kind="stats")az.plot_posterior(idata2f);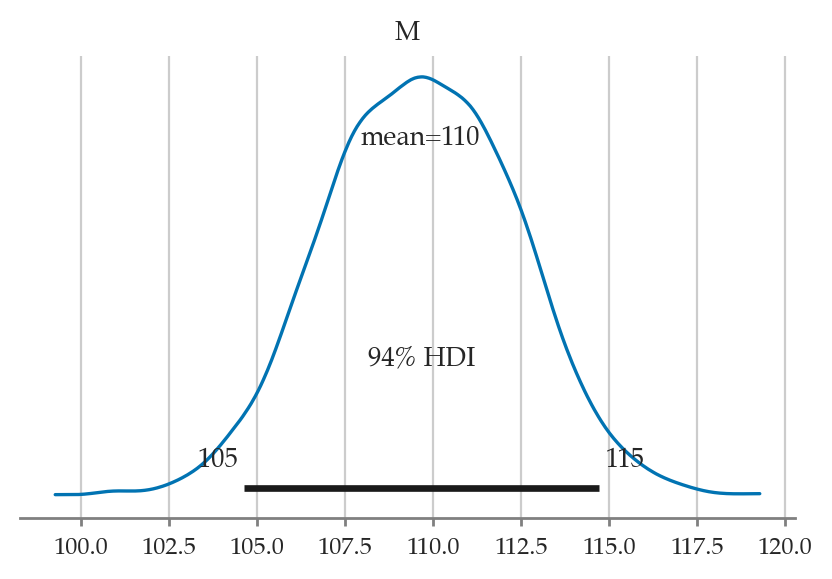
Sensitivity analysis
# TODO: reproduce sensitivity analysis from Secion 5.1Iterative model building
Discussion
Other types of priors
Conjugate priors
Uninformative priors
Software for Bayesian inference
Computational cost
Reporting Bayesian results
Model predictions (BONUS TOPIC)
Coin toss predictions
Let’s generate some observations form the posterior predictive distribution.
idata1_pred = idata1.copy()
# MAYBE: alt notation _rep instead of _pred ?
mod1.predict(idata1_pred, kind="response")
ctosses_pred = az.extract(idata1_pred,
group="posterior_predictive",
var_names=["ctoss"]).values
numheads_pred = ctosses_pred.sum(axis=0)
sns.histplot(x=numheads_pred, bins=range(15,50));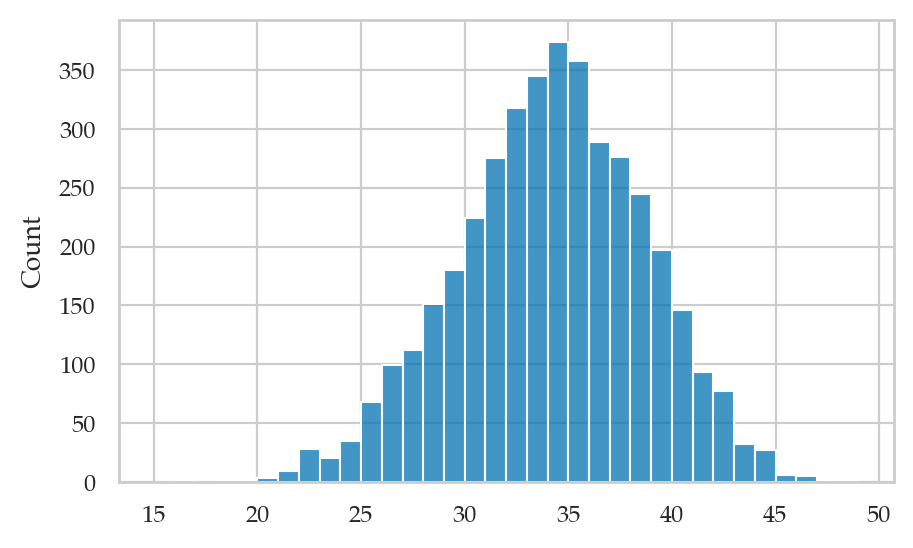
IQ predictions
## Can't use Bambi predict because of issue
## https://github.com/bambinos/bambi/issues/850
# idata2_pred = mod2.predict(idata2, kind="response", inplace=False)
# preds2 = az.extract(idata2_pred, group="posterior", var_names=["mu"]).values.flatten()from scipy.stats import norm
sigma = 15 # known population standard deviation
iq_preds = []
np.random.seed(42)
for i in range(1000):
mu_post = np.random.choice(postM)
iq_pred = norm(loc=mu_post, scale=sigma).rvs(1)[0]
iq_preds.append(iq_pred)
sns.histplot(x=iq_preds);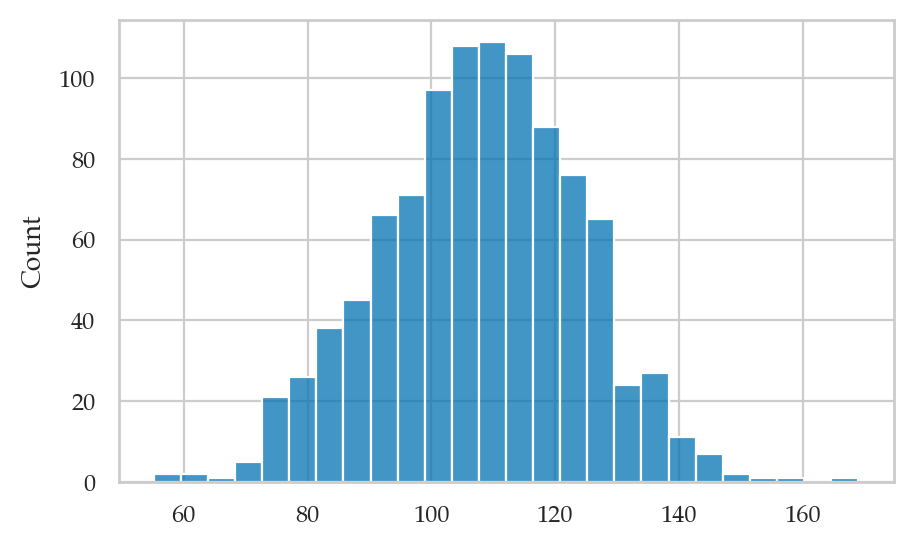
Exercises
TODO: repeat exercises form Sec 5.1 using Bambi and ArviZ
Exercise A
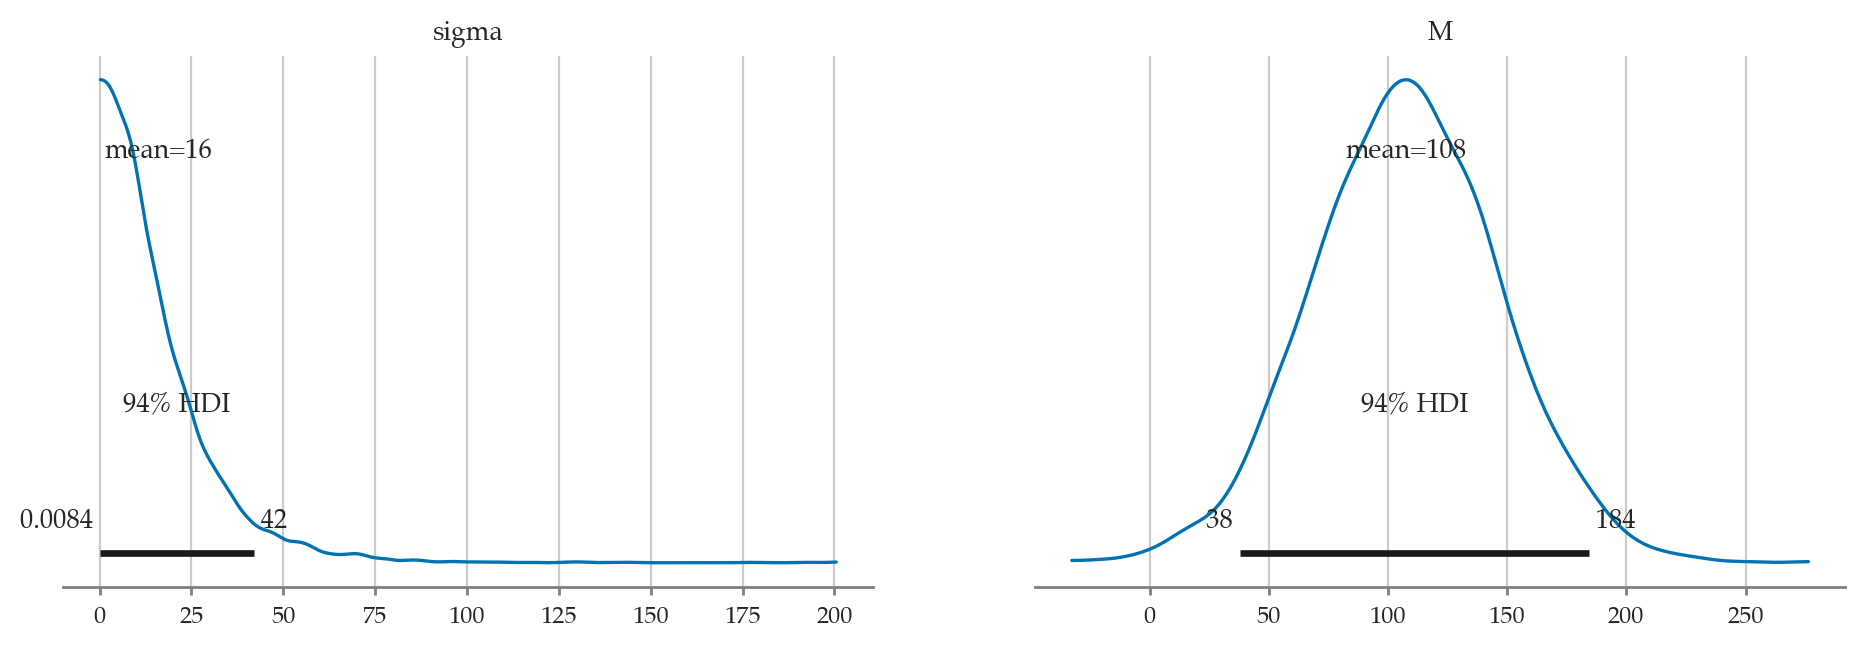
Reproduce the analysis of the IQ scores data from Example 2, but this time use a model with Bambi default priors.
a) Plot the priors using plot_priors.
b) Compute the posterior mean, std, and a 90% hdi.
c) Compare your result in (b) to the results we obtained from Example 2.
mod2d = bmb.Model("iq ~ 1", family="gaussian", data=iqs)
mod2d.set_alias({"Intercept": "M"})
mod2d.build()
mod2d.plot_priors();
Sampling: [M, sigma]
idata2d = mod2d.fit(draws=2000, random_seed=42)
az.summary(idata2d, var_names="M", kind="stats", hdi_prob=0.9)
Initializing NUTS using jitter+adapt_diag...
Multiprocess sampling (4 chains in 4 jobs)
NUTS: [sigma, M]
Sampling 4 chains for 1_000 tune and 2_000 draw iterations (4_000 + 8_000 draws total) took 2 seconds.
az.summary(idata2, kind="stats", hdi_prob=0.9)az.plot_forest(data=[idata2, idata2d],
model_names=["Example 2 prior", "Default priors"],
var_names="M", combined=True, figsize=(7,2));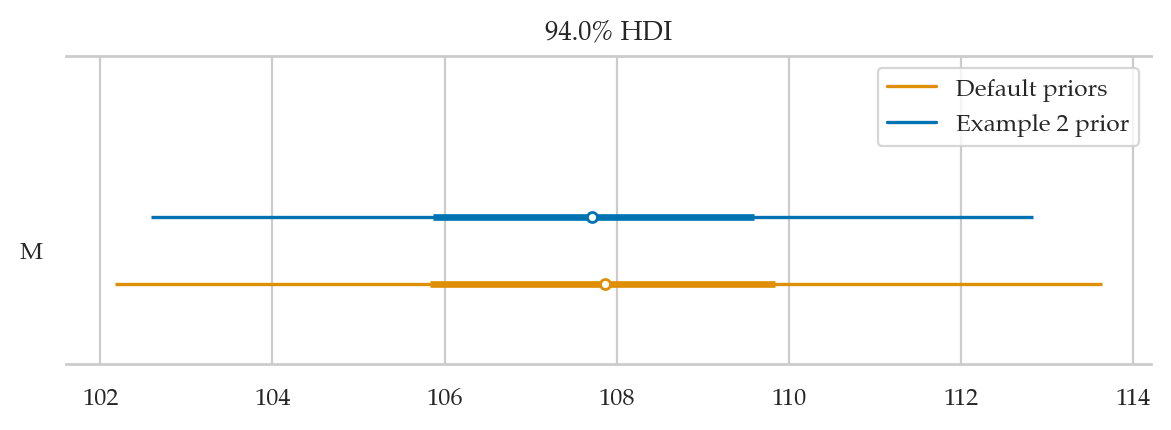
Exercise B
Repeat the analysis in Example 2,
but this time use the exponential prior
on the parameter sigma. Calculate:
a) Plot the priors using plot_priors.
b) Compute posterior mean of M and sigma.
c) Compute the posterior median of M and sigma.
d) Compute 90% credible interval for M and sigma.
import bambi as bmb
priors2e = {
    "Intercept": bmb.Prior("Normal", mu=100, sigma=40),
    "sigma": bmb.Prior("Exponential", lam=0.1),
}

mod2e = bmb.Model(formula="iq ~ 1",
                  family="gaussian",
                  link="identity",
                  priors=priors2e,
                  data=iqs)
mod2e.set_alias({"Intercept": "M"})
mod2e.build()
mod2e.plot_priors();Sampling: [M, sigma]
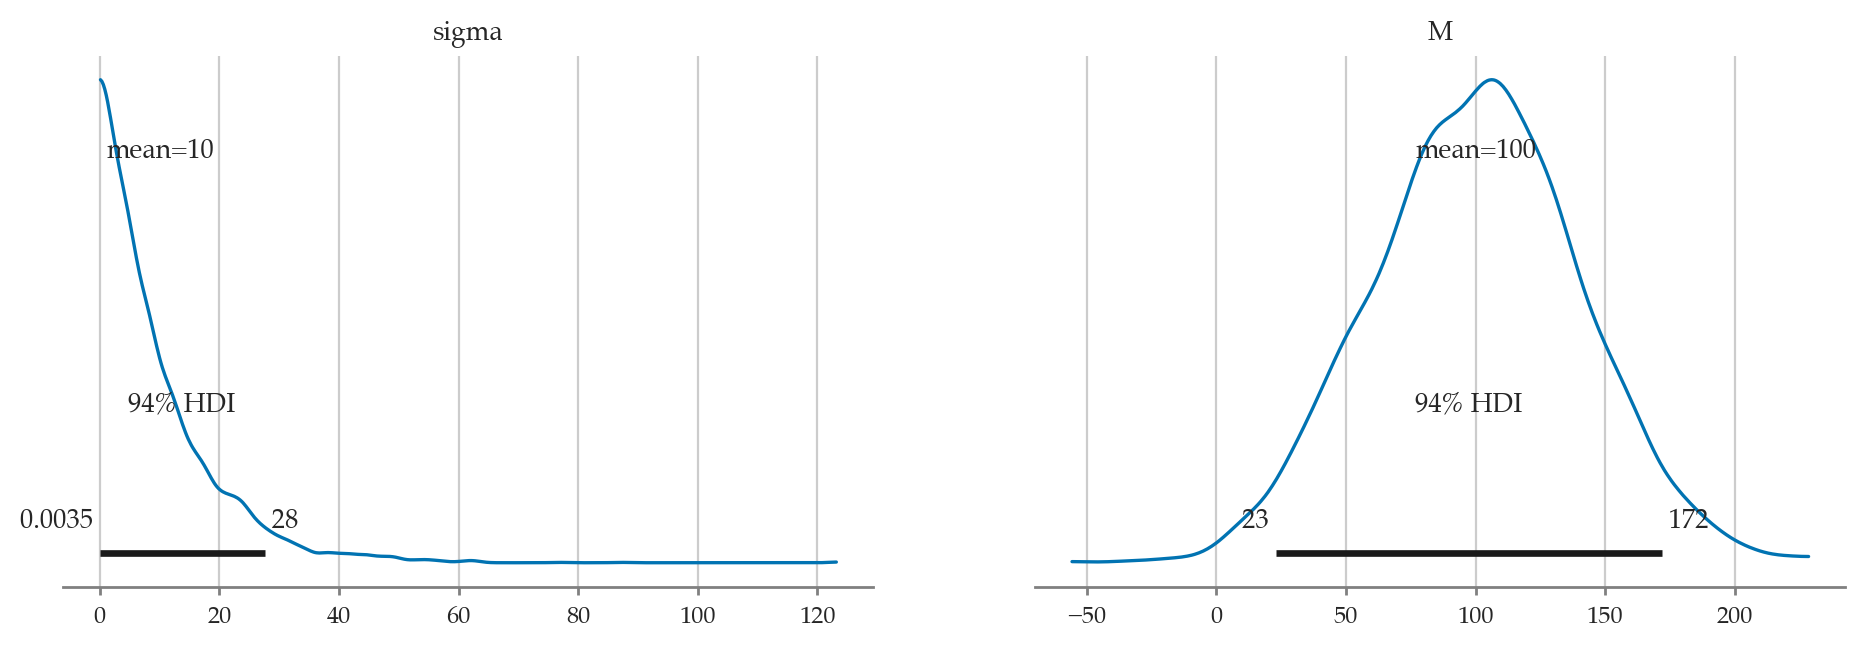
# idata2e = mod2e.fit(random_seed=42)
# az.plot_posterior(idata2e)
# JOINT PLOT
# M_samples = idata2e.posterior['M'].values.flatten()
# sigma_samples = idata2e.posterior['sigma'].values.flatten()
# sns.kdeplot(x=M_samples, y=sigma_samples, fill=True)
# plt.xlabel('M')
# plt.ylabel('Sigma')
# plt.title('Density Plot of Mean vs Sigma')Exercise C
Links
TODO