This notebook contains the code examples from Section 5.1 Introduction to Bayesian statistics from the No Bullshit Guide to Statistics.
Notebook setup
# Ensure required Python modules are installed
%pip install --quiet numpy scipy seaborn statsmodels bambi ministats
Note: you may need to restart the kernel to use updated packages.
# Load Python modules
import numpy as np
import pandas as pd
import seaborn as sns
import matplotlib.pyplot as plt
# Figures setup
plt.clf() # needed otherwise `sns.set_theme` doesn't work
sns.set_theme(
context="paper",
style="whitegrid",
palette="colorblind",
rc={"font.family": "serif",
"font.serif": ["Palatino", "DejaVu Serif", "serif"],
"figure.figsize": (5,3)},
)
%config InlineBackend.figure_format = "retina"<Figure size 640x480 with 0 Axes># Simple float __repr__
if int(np.__version__.split(".")[0]) >= 2:
np.set_printoptions(legacy='1.25')Definitions
Data model and likelihood function
Parameters distributions
Bayesian model
Calculating the posterior distribution
Bayesian inference results
Visualizing the posterior
from ministats.plots.figures import posterior_visualization
posterior_visualization(heads=4, n=5)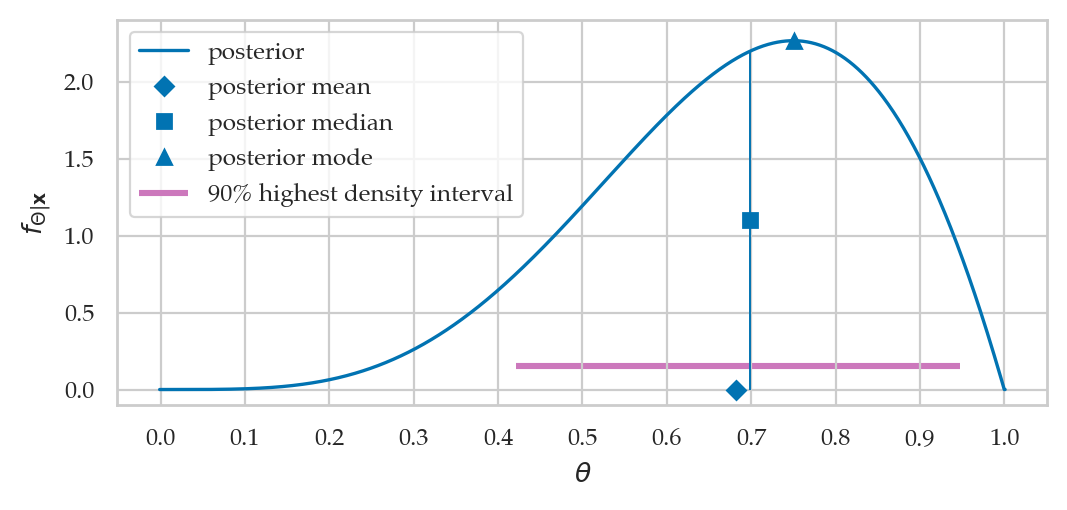
Point estimates
posterior mean
posterior median
posterior mode
Bayesian credible interval
high density interval
Bayesian predictions
draws form the posterior predictive distribution
Bayesian hypothesis testing
TODO
Bayesian inference
TODO: add explanations and formulas
Bayesian updating of posterior probabilities
from ministats.plots.figures import prior_times_likelihood_eq_posterior
prior_times_likelihood_eq_posterior(heads=4, n=5)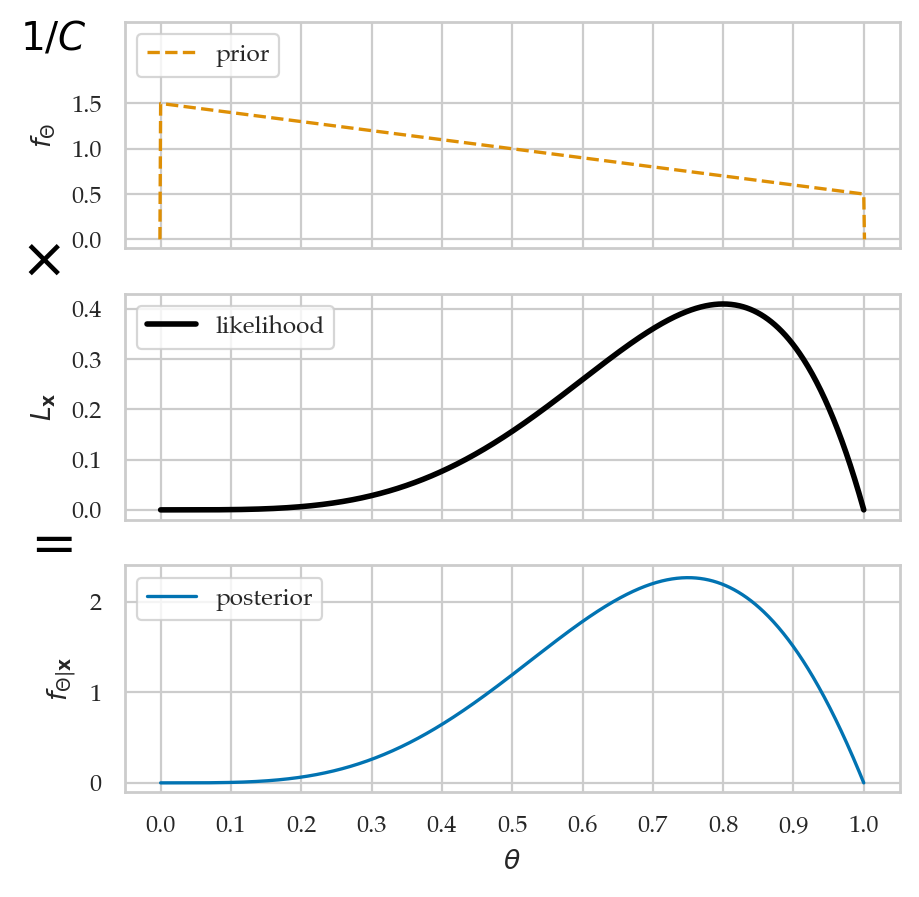
Grid approximation
TODO: add explanations and formulas
TODO: add steps
Pseudocode:
prior_rv = ... # specify the prior distribtion
model = ...    # specify the data model

# 1. Define the grid of possible parameter values
thetas = [0, 0.05, 0.10, 0.15, ..., 1.0]

# 2. Evaluate the prior distribution for all thetas
prior = [prior_rv.pdf(th) for th in thetas]

# 3. Compute the likelihood of the data for all thetas
likelihood = [model(th).pdf(data) for th in thetas]

# 4. Calculate the numerator in Bayes' formula
numerator = np.multiply(likelihood, prior)

# 5. Normalize to obtain the posterior distribution
posterior = numerator / np.sum(numerator)
from ministats.plots.figures import prior_times_likelihood_eq_posterior_grid
prior_times_likelihood_eq_posterior_grid(heads=4, n=5)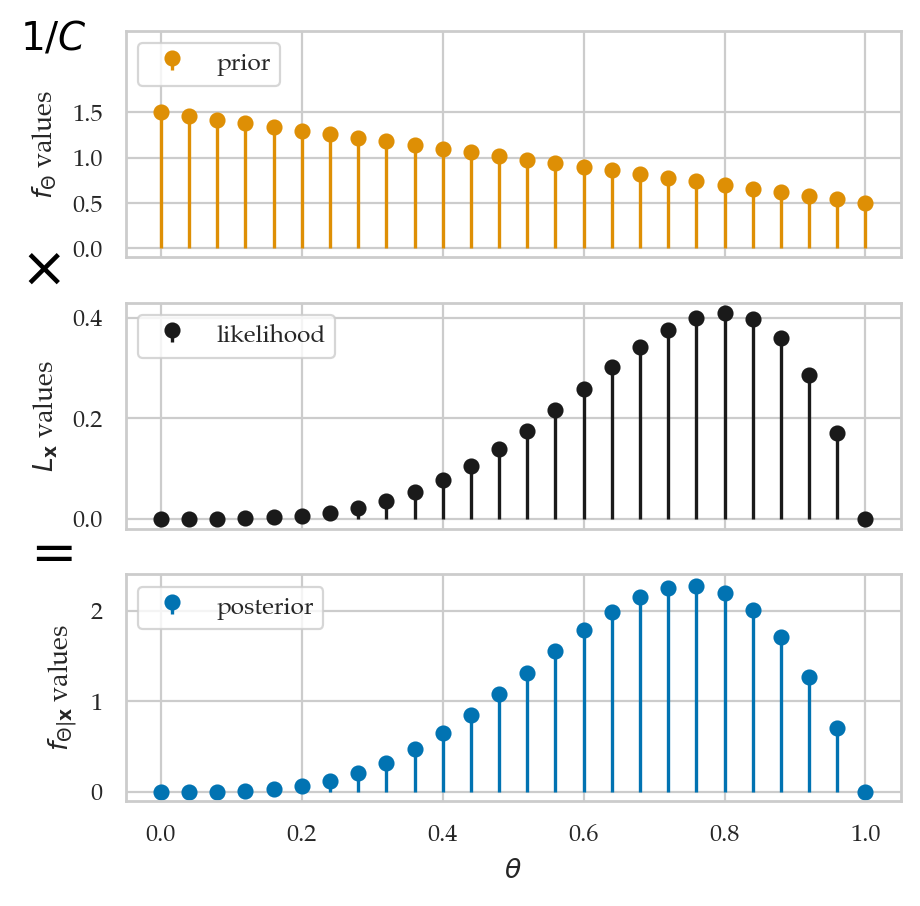
Example 1: estimating the probability of a biased coin
Suppose we’re given a biased coin and we want to estimate the probability the coin turns up heads.
Data
We have a sample that contains observations (coin tosses) from the coin.
The outcome 1 corresponds to heads,
while the outcome 0 corresponds to tails.
ctosses = [1,1,0,0,1,0,1,1,1,1,1,0,1,1,0,0,0,1,1,1,
           1,1,1,1,1,1,1,0,1,1,1,1,1,1,1,1,0,0,1,0,
           0,1,0,1,0,1,0,1,1,0]

sum(ctosses), len(ctosses), sum(ctosses)/len(ctosses)
(34, 50, 0.68)Model
The Bayesian model for the coin tosses is describe by the Bernoulli distribution with a uniform prior on the parameter:
To estimate the parameter , we’ll use the Bayesian inference following the five-step grid approximation procedure.
Step 1: define a grid of possible parameter values
We start by defining a grid for the possible values for the parameter . We’ll cover the interval from 0 to 1 using a grid with 100 steps.
ngrid1 = 101             # number of points in the grid
ps = np.linspace(0, 1, ngrid1) # [0, 0.01, ..., 1.0]
ps[0:5]
array([0. , 0.01, 0.02, 0.03, 0.04])Step 2: define a flat prior distribution
from scipy.stats import uniform
prior1 = uniform(0,1).pdf(ps)
prior1[0:5]
array([1., 1., 1., 1., 1.])Step 3: compute the likelihood
Next we want to compute the likelihood of the data according to the model .
Recall that the likelihood function is the product of the probabilities for individual observations
where we have defined the total number of heads in the data .
We can use now use this formula to calculate the likelihood of the data
for all the values of the parameters in the grid ps.
y = sum(ctosses)
n = len(ctosses)
likelihood1 = ps**y * (1-ps)**(n-y)

likelihood1[0:101:25]
array([0.00000000e+00, 3.39578753e-23, 8.88178420e-16, 1.31559767e-14,
0.00000000e+00])Step 4: calculate the numerator in Bayes’ formula
Next we multiply the likelihood and the prior to obtain the numerator of the Bayes’ rule formula.
numerator1 = likelihood1 * prior1

numerator1[0:101:25]
array([0.00000000e+00, 3.39578753e-23, 8.88178420e-16, 1.31559767e-14,
0.00000000e+00])Step 5: normalize to obtain the posterior distribution
The final step is to make sure the posterior is a valid probability distribution.
posterior1 = numerator1 / np.sum(numerator1)

posterior1[0:101:25]
array([0.00000000e+00, 8.52710007e-11, 2.23028862e-03, 3.30357328e-02,
0.00000000e+00])We can verify that the sum of the values in the array posterior1 is 1.
np.sum(posterior1).round(15)1.0Visualizing the posterior
posterior1d = posterior1 / (ps[1] - ps[0])
sns.lineplot(x=ps, y=posterior1d, label="posterior")
sns.lineplot(x=ps, y=prior1, ls="--", label="prior");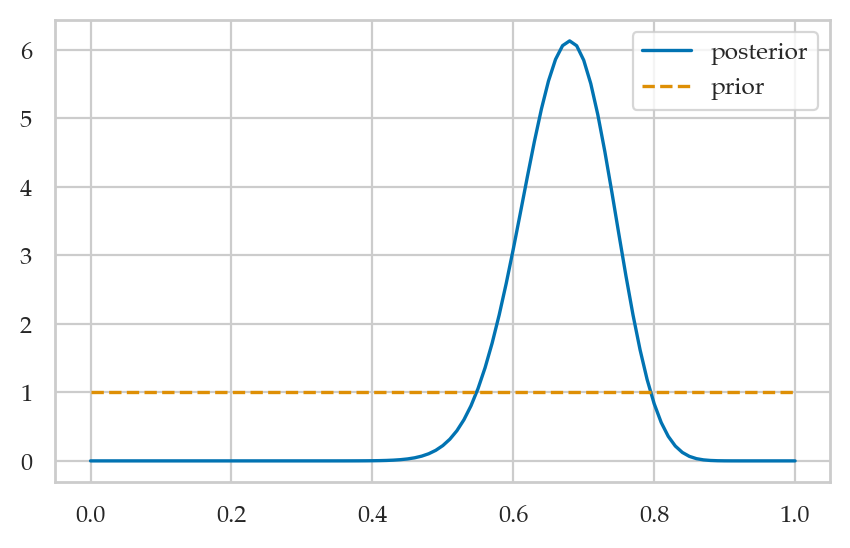
Summarize the posterior
Posterior mean
postmu1 = np.sum(ps * posterior1)
postmu10.673076923076923Posterior standard deviation
poststd1 = np.sqrt(np.sum((ps-postmu1)**2*posterior1))
poststd10.06443431329777005Posterior median
cumsum1 = np.cumsum(posterior1)
idxMed = cumsum1.searchsorted(0.5)
ps[idxMed]0.68Posterior quartiles
idxQ1 = cumsum1.searchsorted(0.25)
idxQ2 = cumsum1.searchsorted(0.5)
idxQ3 = cumsum1.searchsorted(0.75)
ps[idxQ1], ps[idxQ2], ps[idxQ3]
(0.63, 0.68, 0.72)Posterior percentiles
idxP03 = cumsum1.searchsorted(0.03)
idxP97 = cumsum1.searchsorted(0.97)
ps[idxP03], ps[idxP97]
(0.55, 0.79)Posterior mode
ps[np.argmax(posterior1)]0.68Credible interval
from ministats import hdi_from_grid
hdi_from_grid(ps, posterior1, hdi_prob=0.9)
[0.54, 0.76]Visualizing the posterior updates over time
from ministats.plots.figures import panel_coin_posteriors
panel_coin_posteriors()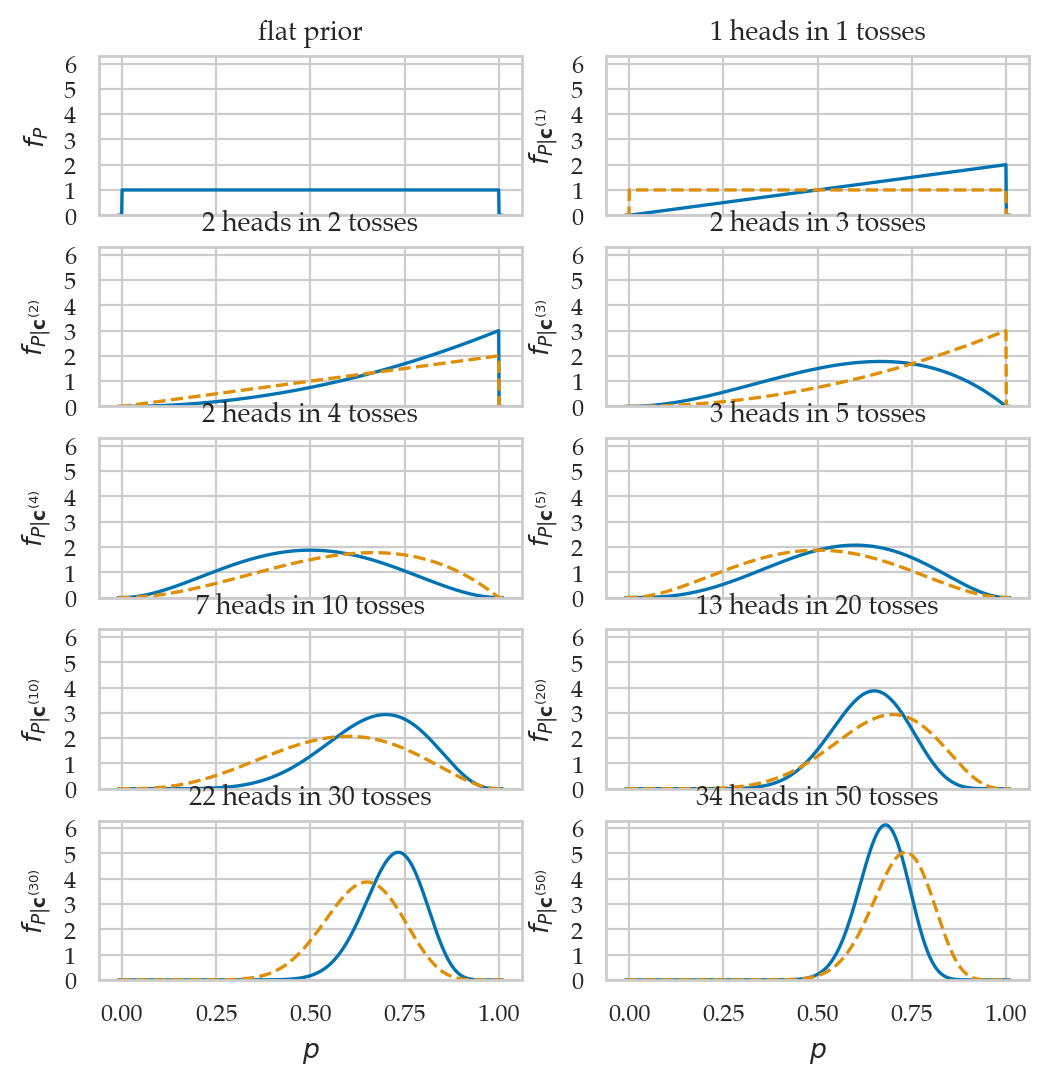
Example 2: estimating the IQ score
Suppose we’re investigating the effect of a new smart drug. We give the drug to a sample of 30 individuals who are representative of the population, then make them take an IQ test.
Data
We have a sample of IQ measurements from people who took the smart drug.
iqs = [ 82.6, 105.5,  96.7,  84.0, 127.2,  98.8,  94.3,
       122.1,  86.8,  86.1, 107.9, 118.9, 116.5, 101.0,
        91.0, 130.0, 155.7, 120.8, 107.9, 117.1, 100.1,
       108.2,  99.8, 103.6, 108.1, 110.3, 101.8, 131.7,
103.8, 116.4]Model
We will use the following Bayesian model:
We place a broad prior on the mean parameter , by choosing a large value for the standard deviation . We assume the IQ scores come from a population with known standard deviation .
Step 1: define a grid of possible values of the mean
This time we’ll use a finer grid with 1000 steps. The parameter space for the mean of a normal distribution is infinite , so we can’t define a grid that covers the whole parameter space. Instead, we’ll define a grid that cover only the most likely values for the mean, which is a window of around the mean of the wider population.
ngrid2 = 1001  # number of points in the grid
mus = np.linspace(80, 120, ngrid2)
mus[0:5]
array([80. , 80.04, 80.08, 80.12, 80.16])Step 2: define the prior for the unknown mean
We define a normal distribution centered at with standard deviation ,
then evaluate it for each point in the grid mus.
from scipy.stats import norm

mu_M = 100
sigma_M = 40
prior2 = norm(loc=mu_M, scale=sigma_M).pdf(mus)

prior2[0:1001:300]
array([0.00880163, 0.00977607, 0.00992381, 0.00920675])sigma = 15 # known population standard deviation
likelihood2 = np.ones(ngrid2)
for iq in iqs:
likelihood_iq = norm(loc=mus, scale=sigma).pdf(iq)
likelihood2 = likelihood2 * likelihood_iq
likelihood2[0:1001:300]array([1.23613569e-77, 1.80497559e-62, 1.20898934e-55, 3.71466415e-57])Steps 4: calculate the numerator in Bayes’ rule formula
numerator2 = likelihood2 * prior2

numerator2[0:1001:300]
array([1.08800129e-79, 1.76455630e-64, 1.19977849e-57, 3.41999972e-59])Steps 5: normalize to obtain the posterior distribution
posterior2 = numerator2 / np.sum(numerator2)

posterior2[0:1001:300]
array([2.02698373e-25, 3.28742893e-10, 2.23522850e-03, 6.37157683e-05])Visualizing the posterior
posterior2d = posterior2 / (mus[1] - mus[0])
sns.lineplot(x=mus, y=posterior2d, label="posterior")
sns.lineplot(x=mus, y=prior2, ls="--", linewidth=2, label="prior");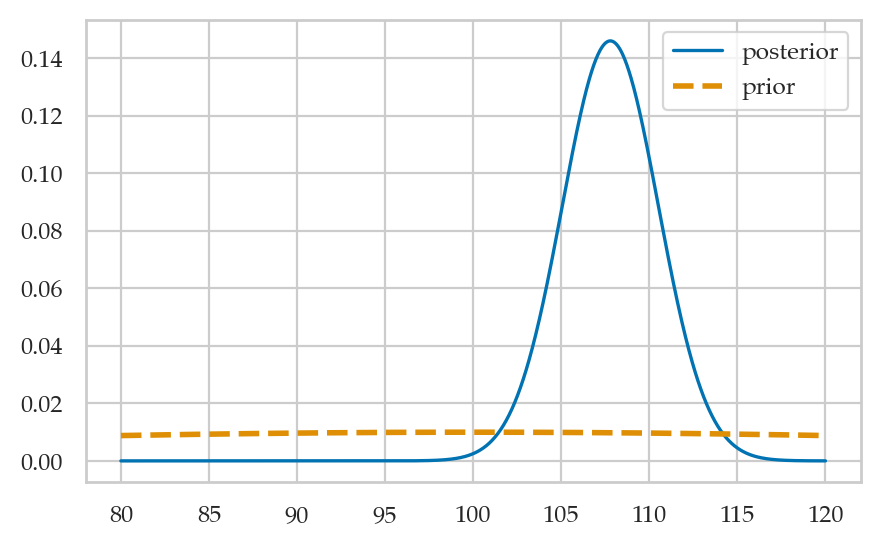
Summarize the posterior
Posterior mean
postmu2 = np.sum(mus * posterior2)
postmu2107.78678422532585Posterior standard deviation
poststd2 = np.sqrt(np.sum((mus-postmu2)**2*posterior2))
poststd22.7321084402431834Posterior median
cumsum2 = np.cumsum(posterior2)
mus[cumsum2.searchsorted(0.5)]107.8Posterior mode
mus[np.argmax(posterior2)]107.8Credible interval for the mean
from ministats import hdi_from_grid
hdi_from_grid(mus, posterior2, hdi_prob=0.9)
[103.16, 112.16]Let’s compare the Bayesian credible interval to the frequentist confidence interval.
from ministats import ci_mean
ci_mean(iqs, method="a", alpha=0.1)
[102.83429390645762, 112.81237276020906]Explanations
Grid approximation details
Choosing priors
# TODO: move this code to `ministats.bayes`

from ministats import hdi_from_grid

def get_post_mean_stats(sample, sigma=15, prior_rv=None, ngrid=10001, xlims=[70,130],
                       stats=["mean", "median", "mode", "hdi90"]):
    mus = np.linspace(*xlims, ngrid)
    prior = prior_rv.pdf(mus)
    likelihoodsM = norm(loc=mus[:,np.newaxis], scale=sigma).pdf(sample)
    likelihood = np.prod(likelihoodsM, axis=1)
    numerator = likelihood * prior
    posterior = numerator / np.sum(numerator)

    # compute stats
    results = {}
    if "mean" in stats:
        post_mean = np.sum(mus * posterior)
        results["post mean"] = post_mean
    if "median" in stats:
        cumsum = np.cumsum(posterior)
        post_median = mus[cumsum.searchsorted(0.5)]
        results["post median"] = post_median
    if "mode" in stats:
        post_mode = mus[np.argmax(posterior)]
        results["post mode"] = post_mode
    if "hdi90" in stats:
        hdi90 = hdi_from_grid(mus, posterior, hdi_prob=0.9)
        results["hdi90"] = [hdi90[0].round(3), hdi90[1].round(3)]
    if "prob_lt_100" in stats:
        idx100 = mus.searchsorted(100)
        prob_lt_100 = np.sum(posterior[0:idx100])
        results["prob_lt_100"] = prob_lt_100
    return results
# frequentist summary
from ministats import ci_mean
np.mean(iqs), ci_mean(iqs, alpha=0.1)(107.82333333333334, [102.83429390645762, 112.81237276020906])# TODO: move this code to `ministats.book.figures`
from ministats import plot_pdf
priors = [
norm(loc=100, scale=40),
# varying mu_M
norm(loc=80, scale=40),
norm(loc=50, scale=40),
norm(loc=0, scale=40),
# varying sigma_M
norm(loc=100, scale=30),
norm(loc=100, scale=20),
norm(loc=100, scale=10),
norm(loc=100, scale=5),
norm(loc=100, scale=3),
norm(loc=100, scale=1),
]
def get_label(prior):
mu = str(prior.kwds["loc"])
sigma = str(prior.kwds["scale"])
return r"$\mathcal{N}(" + mu + "," + sigma + ")$"
linestyles = ["dashed", "dotted", "dashdot", (5, (10, 3))]
xlims = [80,120]
with plt.rc_context({"figure.figsize":(6.5,2.6)}):
fig, (ax1,ax2) = plt.subplots(1,2, sharey=True)
for prior, ls in zip(priors[4:7], linestyles):
plot_pdf(prior, ax=ax1, ls=ls, color="C1", xlims=xlims, label=get_label(prior))
for prior, ls in zip(priors[7:], linestyles):
plot_pdf(prior, ax=ax2, ls=ls, color="C1", xlims=xlims, label=get_label(prior))
ax1.set_ylim(-0.003, 0.14)
ax1.set_xlabel(r"$\mu$")
ax1.set_ylabel(r"$f_M$")
ax1.set_title("(a) Diffuse priors")
ax2.set_xlabel(r"$\mu$")
ax2.set_title("(b) Concentrated priors")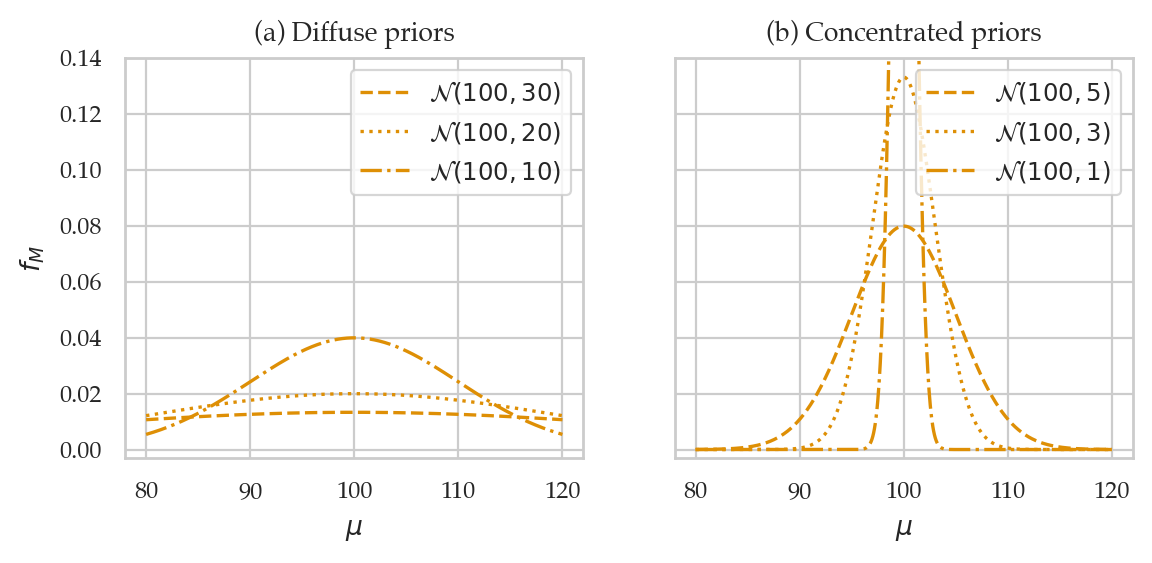
# TODO: move this code to `ministats.book.tables`

results_list = []
for prior in priors:
    stats = get_post_mean_stats(iqs, prior_rv=prior)
    result = prior.kwds.copy()
    stats["hdi90"] = [np.round(stats["hdi90"][0], 2), np.round(stats["hdi90"][1], 2)]
    result.update(stats)
    results_list.append(result)

results = pd.DataFrame(results_list)
results = results.round({"post mean":2, "post median":2, "post mode":2, "prob_lt_100":5})
results
# print(results.to_latex(index=False,formatters=[lambda x: "$" + str(x) + "$"]*7))Bayesian predictions
Predicting future coin tosses
np.random.seed(43)

from scipy.stats import bernoulli

ctoss_preds = []
for i in range(20):
    p_post = np.random.choice(ps, p=posterior1)
    ctoss_pred = bernoulli(p=p_post).rvs(1)[0]
    ctoss_preds.append(ctoss_pred)
ctoss_preds
[0, 1, 0, 1, 0, 0, 1, 1, 1, 0, 0, 0, 1, 0, 1, 1, 1, 0, 1, 1]Predicting IQ scores
np.random.seed(43)

sigma = 15  # known population standard deviation

iq_preds = []
for i in range(7):
    mu_post = np.random.choice(mus, p=posterior2)
    iq_pred = norm(loc=mu_post, scale=sigma).rvs(1)[0]
    iq_preds.append(iq_pred)
np.round(iq_preds, 2)
array([ 89.64, 110.31, 112.65, 121.25, 92.55, 132.49, 98.97])Bayesian hypothesis testing
Suppose we want to evaluate whether the IQ data measurements iqs
comes from a population with a mean or not,
which corresponds to the null hypothesis (the smart drug was not effective).
Using credible intervals for decisions
Consider the null hypothesis . We can informally reject this hypothesis, since the value is outside the 90% credible interval.
hdi95 = hdi_from_grid(mus, posterior2, hdi_prob=0.95)
hdi95
[102.32, 113.03999999999999]Region of practical equivalence
We can also compute the total probability of in the posterior that falls within the region of practical equivalence (ROPE) .
mu97 = mus.searchsorted(97)
mu103 = mus.searchsorted(103)
np.sum(posterior2[mu97:mu103+1])0.040481237454239115Hypothesis test
We see the probability of or smaller is around , which gives us reason to reject .
This conclusion is consistent with the conclusion of the frequentist one-sample -test, which leads us to reject .
from scipy.stats import ttest_1samp
tt_res = ttest_1samp(iqs, 100, alternative="greater")
tt_res.statistic, tt_res.pvalue
(2.664408108831371, 0.006232014580899188)Bayesian model comparison
In Bayesian model comparison, we want compare the posterior probability distributions of two models:
The null hypothesis is while the alternative hypothesis . Actually, we need to be more specific and show the full Bayesian model under each distribution:
Under H0
...
Under H1
...
Bayes factors
TODO: show formulas
Test 1: using a point null and Cauchy on effect size
# under H0 = point-prior at mu=100
from scipy.stats import norm

sigma = 15  # known population standard deviation
mlikelihood_H0 = np.prod(norm(loc=100, scale=sigma).pdf(iqs))
mlikelihood_H05.415023175654286e-57We’ll set a prior on the effect size , using the Cauchy distribution (very fat tails).
from scipy.stats import cauchy

r = 1  # scale for the Cauchy prior
plot_pdf(cauchy(scale=r), xlims=[-5,5]);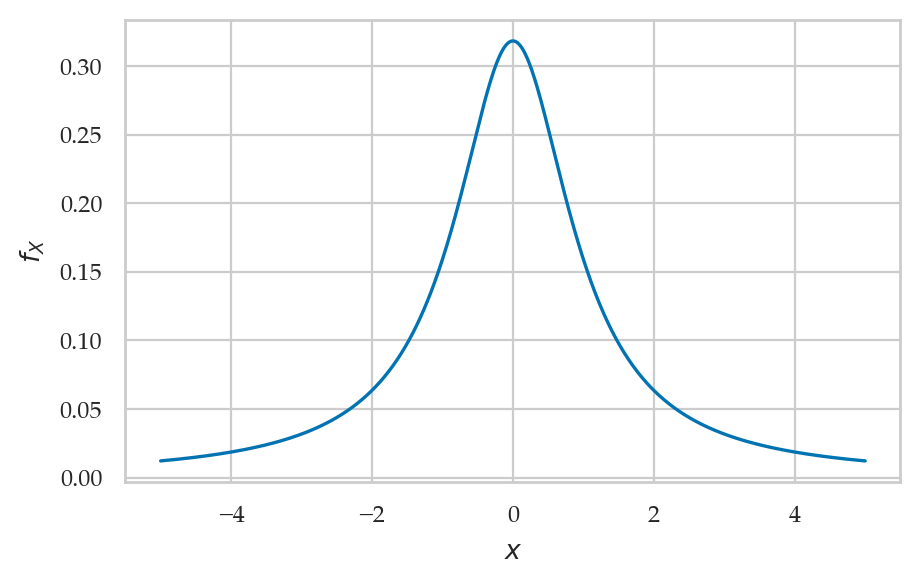
from scipy.integrate import quad

r = 1  # scale for the Cauchy prior
prior_delta = cauchy(scale=r)
delta_max = 10

def integrand(delta):
    # Convert delta into the mean under H1: mu = 100 + delta * sigma
    mu = 100 + delta * sigma
    # Likelihood as the product of normal densities for each observation
    likelihood = np.prod(norm(loc=mu, scale=sigma).pdf(iqs))
    prior = cauchy(loc=0, scale=r).pdf(delta)
    return likelihood * prior

mlikelihood_HA, _ = quad(integrand, -delta_max, delta_max)
print(mlikelihood_HA)

simple_BF_A0 = mlikelihood_HA / mlikelihood_H0
simple_BF_A0
3.647361365721922e-56
6.7356338974139645mugrid = np.linspace(-50, 250, 1001)
# under HA = diffuse prior
deltas = (mugrid-100) / sigma
prior_rv = cauchy(scale=r)
prior = prior_rv.pdf(deltas)
norm_const = prior_rv.cdf(10) - prior_rv.cdf(-10)
prior = prior / np.sum(prior) * norm_const
likelihood_HA = np.prod(norm(loc=mugrid[:,np.newaxis], scale=sigma).pdf(iqs), axis=1)
mlikelihood_HA_alt = np.sum(likelihood_HA * prior)
print(mlikelihood_HA_alt)
simple_BF_A0_alt = mlikelihood_HA_alt / mlikelihood_H0
simple_BF_A0_alt3.649465841847485e-56
6.739520263284058# TODO: move this code to `ministats.bayes`
import numpy as np
from scipy.stats import norm, cauchy
from scipy.integrate import quad
# finite integration limits to avoid `np.inf`
simgma_max = 50
delta_max = 10
# Known mean under H0
mu_0 = 100
# Scale parameter under H1
r = 0.707 # scale for the Cauchy prior
# Define the marginal likelihood under H0 using Jeffreys prior for sigma
def marginal_likelihood_H0(iqs, mu_0):
"""
Marginal likelihood under H0 with Jeffreys prior for sigma.
"""
def integrand(sigma):
# Likelihood as the product of normal densities for each observation
likelihood = np.prod(norm.pdf(iqs, loc=mu_0, scale=sigma))
# ALT.
# likelihood = np.prod([norm.pdf(iq, loc=mu_0, scale=sigma) for iq in iqs])
prior = 1 / sigma # Jeffrey's prior for sigma
return likelihood * prior
result, _ = quad(integrand, 0, simgma_max) # limit=1000)
return result
m0 = marginal_likelihood_H0(iqs, mu_0)
# print(m0)
# Define the marginal likelihood under H1, integrating over delta and sigma
def marginal_likelihood_HA(iqs, mu_0):
"""
Marginal likelihood under H1 integrating over delta and sigma.
"""
def integrand(delta, sigma):
# Convert delta into the mean under H1: mu = mu_0 + delta * sigma
mu = mu_0 + delta * sigma
# Likelihood as the product of normal densities for each observation
likelihood = np.prod(norm.pdf(iqs, loc=mu, scale=sigma))
# ALT.
# likelihood = np.prod([norm.pdf(iq, loc=mu, scale=sigma) for iq in iqs])
prior_delta = cauchy(loc=0, scale=r).pdf(delta)
prior_sigma = 1 / sigma # Jeffrey's prior for sigma
return likelihood * prior_delta * prior_sigma
# Inner integral sigma for a given delta
def integrate_delta(delta):
return quad(lambda sigma: integrand(delta, sigma), 0, simgma_max)[0]
# Outer integral over delta
result, _ = quad(integrate_delta, -delta_max, delta_max)
return result
mA = marginal_likelihood_HA(iqs, mu_0)
# print(mA)
# Compute the Bayes factor
BF_A0 = mA / m0
print(f"Bayes Factor (BF_A0): {BF_A0}")Bayes Factor (BF_A0): 3.720150734157743
# Bayes factor (based on JZS prior)
import pingouin as pg
pg.ttest(iqs, 100).loc["T-test","BF10"]'3.74'# ALT. Bayes factor (based on JZS prior)
n = len(iqs)
tstat = (np.mean(iqs) - 100) / np.std(iqs, ddof=1) * np.sqrt(n)
pg.bayesfactor_ttest(tstat, nx=n)3.7397058298821895# TODO: sensitivity analysis
# plot BF for multiple values of r# Compare to the frequentist result
from scipy.stats import ttest_1samp
ttest_1samp(iqs, popmean=100)TtestResult(statistic=2.664408108831371, pvalue=0.012464029161798377, df=29)Discussion
Maximum a posteriori estimates
Comparing Bayesian and frequentist approaches to statistical inference
Strengths and weaknesses of Bayesian approach
Sampling from the posterior (BONUS TOPIC)
We’ll now show how to analyze the Bayesian analysis when the posterior distribution is available in the form of samples. This will be the form of analysis in all the future sections of the chapter, so I thought I can give you a little preview.
We start by generating some samples from the posterior distribution we obtained in Example 2.
np.random.seed(42)
postM = np.random.choice(mus, size=10000, replace=True, p=posterior2)
sns.kdeplot(postM);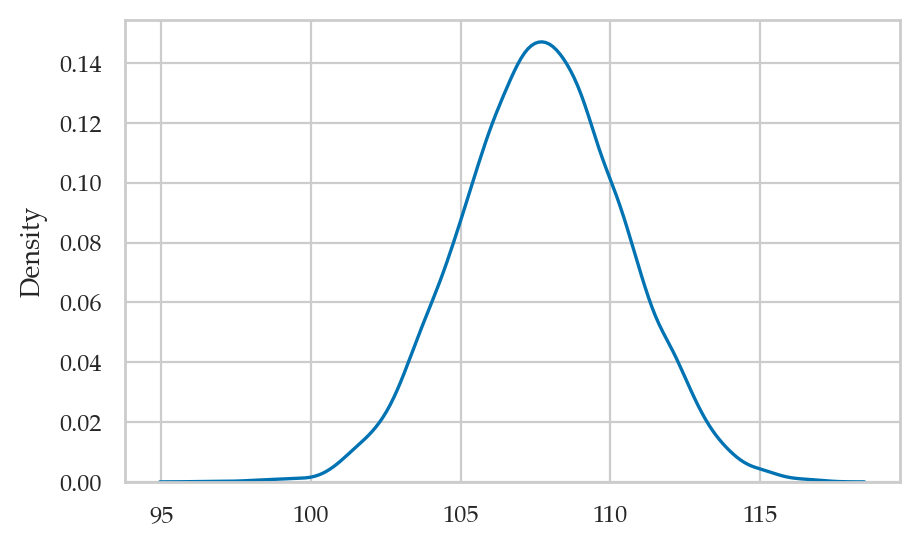
Posterior mean
To compute the mean of the posterior, we compute the mean of the samples.
postMmu = np.mean(postM)
postMmu107.73182In the next seciton,
we’ll also learn about the ArviZ library,
which is a Swiss Army knife for for summarizing, visualizing, and plotting the Bayesian analysis results.
For example,
we can obtain the mean using the summary function from the ArviZ library.
import arviz as az
az.summary(postM, kind="stats")The summary also includes the posterior standard deviation and the limits of a “94% high density interval” that contains 94% of the posterior probability density.
Posterior standard deviation
To compute the standard deviation of the posterior, we compute the standard deviation of the samples.
np.sqrt(np.sum((postM-postMmu)**2) / len(postM))2.712109726320084Posterior median
To compute the median of the posterior, we compute the median of the samples.
np.median(postM)107.72We can also obtain median using the ArviZ summary function,
if we specify the stat_focus option.
az.summary(postM, kind="stats", stat_focus="median")Credible interval
from ministats import hdi_from_samples
hdi_from_samples(postM, hdi_prob=0.9)
[103.28, 112.16]az.summary(postM, kind="stats", hdi_prob=0.9)Exercises
Exercise 1: campaign conversions
See explorations
TODO: check this
Exercise 2: apply Bayes rule for a diagnostic test
You have designed a new test for detecting lung cancer that has the following characteristics:
Test gives a positive result of the time when lung cancer is present.
Test gives a negative result of the time when no lung cancer is present.
You also know that that in the general population, there is approximately one case of lung cancer per 1000 individuals.
Use Bayes rule to calculate the probability that a person who gets a positive test result has cancer, and interpret the result.
# data
pC = 0.001  # prevalence

pPgC = 0.98   # sensitivity
pNgC = 0.02   # false-negatives

pNgNC = 0.96  # specificity
pPgNC = 0.04  # false-positives
# solution
# Pr(P) = Pr(P|C)*Pr(C) + Pr(P|NC) * Pr(NC)
pP = pPgC * pC + pPgNC * (1-pC)
# Pr(C|P) = Pr(P|C) * Pr(C) / Pr(P)
pCgP = pPgC * pC / pP
pCgP0.023937469467513431 - pCgP0.9760625305324866The above calculation tells us 97.6% of people who test positive don’t actually have cancer.
We shouldn’t be screening to the whole population, since that would lead to too many people getting scared for nothing.
See the visualization tool at https://