This notebook contains the code examples from Section 3.5 Two-sample hypothesis tests of the No Bullshit Guide to Statistics.
Notebook setup
# Ensure required Python modules are installed
%pip install --quiet numpy scipy seaborn pandas ministats
[notice] A new release of pip is available: 26.2.1 -> 26.2.2
[notice] To update, run: pip install --upgrade pip
Note: you may need to restart the kernel to use updated packages.
# load Python modules
import os
import numpy as np
import pandas as pd
import seaborn as sns
import matplotlib.pyplot as plt
# Plot helper functions
from ministats import nicebins
from ministats import plot_pdf
from ministats.utils import savefigure
# Stats helper functions
from ministats import tailvalues
from ministats import tailprobs# Figures setup
plt.clf() # needed otherwise `sns.set_theme` doesn't work
sns.set_theme(
context="paper",
style="whitegrid",
palette="colorblind",
rc={"font.family": "serif",
"font.serif": ["Palatino", "DejaVu Serif", "serif"],
"figure.figsize": (5, 1.6)},
)
%config InlineBackend.figure_format = 'retina'<Figure size 640x480 with 0 Axes># Simple float __repr__
if int(np.__version__.split(".")[0]) >= 2:
np.set_printoptions(legacy='1.25')
# set random seed for repeatability
np.random.seed(42)# Download datasets/ directory if necessary
from ministats import ensure_datasets
ensure_datasets()datasets/ directory already exists.
(this cell contains the macro definitions like , , , ...)
Definitions
Populations. We’ll label the two unknown populations and . and assume the arbitrary model family with mean parameter and .
Parameters. The means of the two populations and are unknown, and what we want to study...
Samples. We assume the two samples and are randomly selected from the populations and .
Estimate (statistic) : the difference between means of the two samples and .
Estimator : the function that computes the difference between means from two samples, . the function we use to compute the estimate .
Sampling distribution : the difference between means computed from two random samples and .
Comparing two groups
Description of the problem: compare two group based on sample means computed from each group.
Computing -values
from ministats.book.figures import plot_panel_pvalue_D0_hist_and_dist

fig = plot_panel_pvalue_D0_hist_and_dist();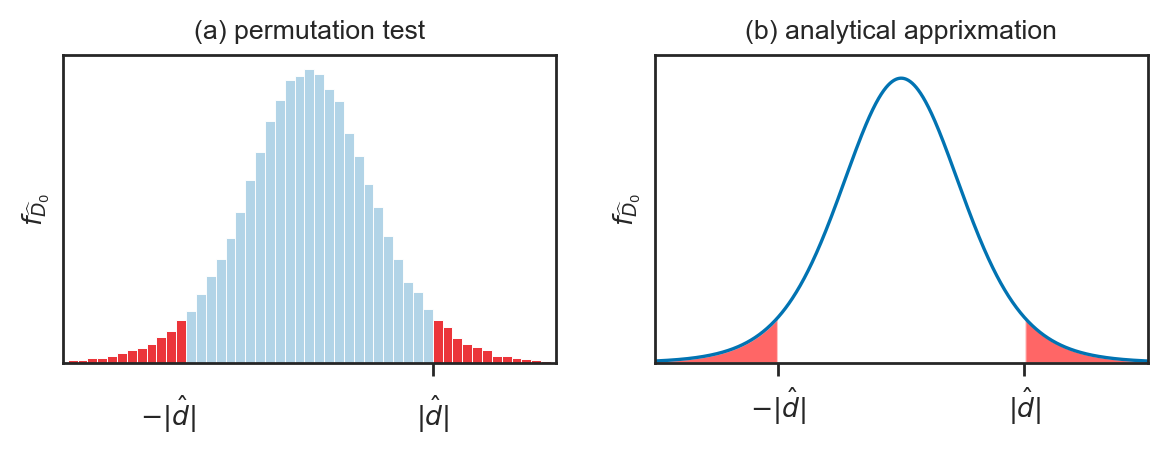
Simulation examples
3.5.1 Difference between means estimator
We’ll now discuss an estimators that is specific for the comparison of the two groups.
estimator:
gives an estimate for the difference between population means:
def dmeans(xsample, ysample):
    """
    Compute the difference between group means of the samples.
    """
    dhat = np.mean(xsample) - np.mean(ysample)
    return dhat
Example N
# Two populations X ~ N(120,13) and Y ~ N(100,17)
from scipy.stats import norm
muX, muY = 120, 100
sigmaX, sigmaY = 13, 17
rvX = norm(muX, sigmaX)
rvY = norm(muY, sigmaY)
# Generate a sample of n=12 from rvX
n = 12
np.random.seed(49)
xsample = rvX.rvs(n)
xsample.round(2)array([106.44, 109.33, 128.65, 143.69, 101.26, 123.04, 124.42, 123.01,
119.87, 143.45, 137.78, 116.6 ])# Generate a sample of m=15 from rvY
m = 15
np.random.seed(53)
ysample = rvY.rvs(m)
ysample.round(2)array([103.5 , 119.83, 64.77, 89.24, 116.95, 140.71, 90.8 , 112.8 ,
63.44, 94.81, 93.17, 89.6 , 97.9 , 91.02, 115.49])# DEBUGGING
bins = range(80,140,5)
# sns.histplot(xsample, bins=bins, alpha=0.3)
# sns.histplot(ysample, bins=bins, alpha=0.3)
sns.kdeplot(xsample, bw_adjust=0.3)
sns.kdeplot(ysample, bw_adjust=0.3);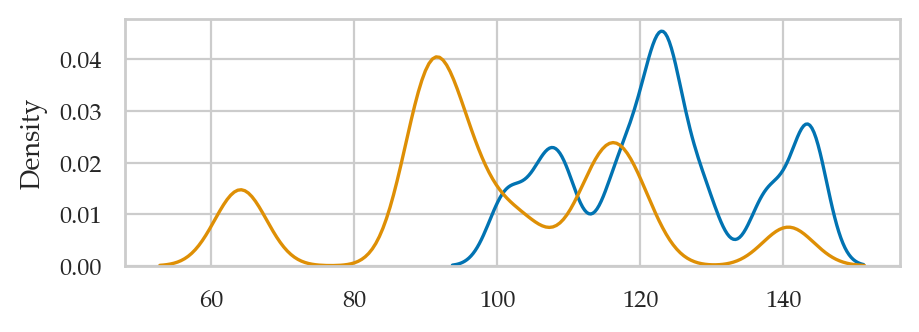
# DEBUGGING
np.mean(xsample), np.std(xsample,ddof=1), np.mean(ysample), np.std(ysample,ddof=1)
(123.12782102038774, 13.761594639978442, 98.93506558107863, 20.322124432018075)Compute the difference between sample means by calling dmeans.
dmeans(xsample, ysample)24.19275543930911Example 3: comparison of electricity prices
Let’s compute the difference between means of the East and West electricity prices.
eprices = pd.read_csv("datasets/eprices.csv")
# eprices
epricesW = eprices[eprices["loc"]=="West"]
pricesW = epricesW["price"]
pricesW9 11.8
10 10.0
11 11.0
12 8.6
13 8.3
14 9.4
15 8.0
16 6.8
17 8.5
Name: price, dtype: float64np.mean(pricesW)9.155555555555557np.var(pricesW)2.1691358024691367epricesE = eprices[eprices["loc"]=="East"]
pricesE = epricesE["price"]
pricesE0 7.7
1 5.9
2 7.0
3 4.8
4 6.3
5 6.3
6 5.5
7 5.4
8 6.5
Name: price, dtype: float64np.mean(pricesE)6.155555555555556np.var(pricesE)0.6846913580246915Let’s calculate the mean of the prices in the East and the West:
np.mean(pricesW), np.mean(pricesE)(9.155555555555557, 6.155555555555556)To calculate the difference between means,
we can simply subtract these two numbers ,
or simply call the function dmeans
which computes the estimate .
dmeans(pricesW, pricesE)3.000000000000001According to this estimate, the average price Rob can expect in the East end is three cents cheaper, on average, as compared to the average electricity price in the West.
Sampling distribution of the difference between means
We assume the two groups are normally distributed random variables and :
Definitions:
=
xsample: a sample of size from=
ysample: a sample of size from .: the observed mean in the first group
: the observed mean in the second group
: the sample variance from the first group
: the sample variance from the second group
: the difference between means estimate, which is an estimate of the true different between population means .
The sampling distribution of the estimator dmeans is defined as:
where and are random samples.
Sampling distribution for known populations
np.random.seed(42)

# Sample sizes
n, m = 12, 15

# Simulate 10K random samples from `rvX` and `rvY`
# and compute the difference between their means.
dhats = []
for j in range(10000):
    xs = rvX.rvs(n)
    ys = rvY.rvs(m)
    dhat = dmeans(xs, ys)
    dhats.append(dhat)

# Plot a histogram of the sampling distribution
ax = sns.histplot(dhats, stat="density", color="C1", alpha=0.5)
ax.set_xlim(-20,45)
ax.set_ylabel("$f_{\\widehat{D}}$");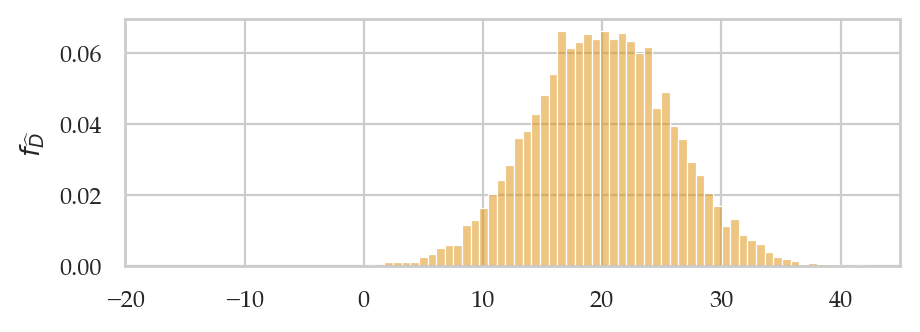
np.std(dhats)5.807648161384639Analytical formula for the sampling distribution
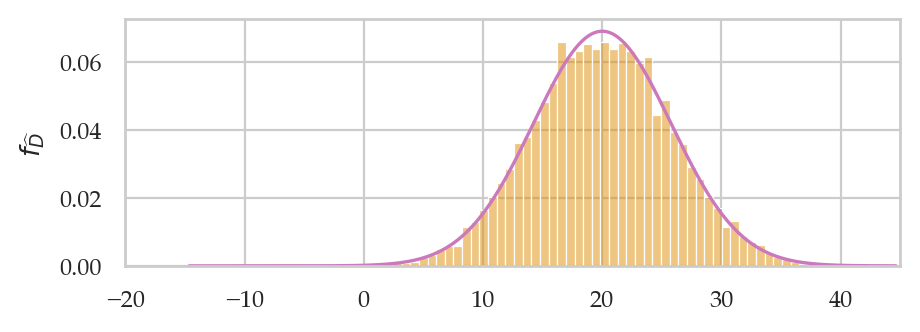
Let’s now use probability theory to build a theoretical model for the sampling distribution of the difference-between-means estimator dmeans.
The central limit theorem tells us the sample mean within the two group are
The rules of probability theory tells us that the difference of two normal random variables requires subtracting their means and adding their variance, so we get:
where the standard error of the estimator is:
# Population parameters
muX, muY = 120, 100
sigmaX, sigmaY = 13, 17

# Sample sizes
n, m = 12, 15

# Standard error
seD = np.sqrt(sigmaX**2/n + sigmaY**2/m)
print("seD =", seD)

# Analytical formula for the sampling distribution
from scipy.stats import norm
rvDhatN = norm(loc=muX-muY, scale=seD)
ax = sns.histplot(dhats, stat="density", color="C1", alpha=0.5)
plot_pdf(rvDhatN, color="C4", ax=ax);
ax.set_xlim(-20,45)
ax.set_xlabel(None)
ax.set_ylabel("$f_{\\widehat{D}}$");
seD = 5.774945887192364
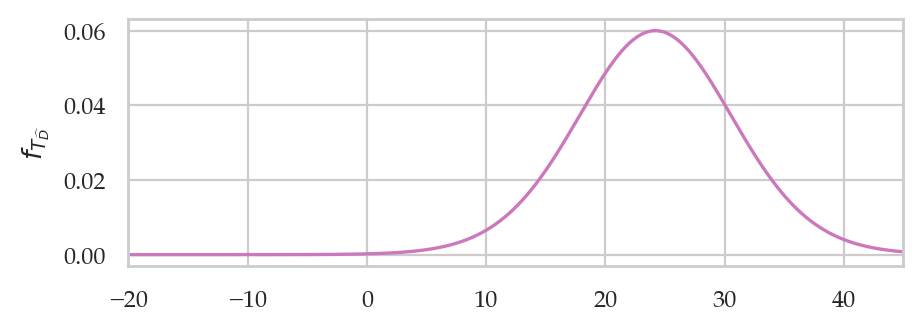
Approximation using Student’s -distribution
Recall the plug-in principle allows us to obtain approximate statistical formulas by replacing population parameters with estimates computed from samples. Applying the plug-in principle to the formula , we obtain a formula for the estimated standard error of the difference between means estimator:
We can now build a model for the sampling distribution of the difference between means estimator based on Student’s -distribution:
where is Student’s -distribution with degrees of freedom.
The degrees of freedom of is obtained by the following formula
Let’s write a Python function that calculates the degrees of freedom parameter.
def calcdf(stdX, n, stdY, m):
    vX = stdX**2 / n
    vY = stdY**2 / m
    df = (vX + vY)**2 / (vX**2/(n-1) + vY**2/(m-1))
    return df

# ALT.
# from ministats import calcdf
Example N (continued): analytical approximation
# Sample statistics
stdX, stdY = np.std(xsample,ddof=1), np.std(ysample,ddof=1)
n, m = len(xsample), len(ysample)
print("stdX =", stdX)
print("stdY =", stdY)

# Estimated standard error
sehatD = np.sqrt(stdX**2/n + stdY**2/m)
print("sehatD =", sehatD)

# Degrees of freedom parameter
dfD = calcdf(stdX, n, stdY, m)
print("dfD =", dfD)

# Observed difference between means
dhat = dmeans(xsample, ysample)
print("dhat =", dhat)

# Construct the analytical approximation to the sampling distribution
from scipy.stats import t as tdist
rvTDhat = tdist(df=dfD, loc=dhat, scale=sehatD)
ax = plot_pdf(rvTDhat, color="C4")
ax.set_xlim(-20,45)
ax.set_xlabel(None)
ax.set_ylabel("$f_{T_{\\widehat{D}}}$");
stdX = 13.761594639978442
stdY = 20.322124432018075
sehatD = 6.5813656142388375
dfD = 24.43259380268516
dhat = 24.19275543930911
Bootstrap approximation to the sampling distribution
First compute bootstrap estimates for mean in each group
from ministats import gen_boot_dist
xbars_boot = gen_boot_dist(xsample, estfunc=np.mean)
ybars_boot = gen_boot_dist(ysample, estfunc=np.mean)
Next we compute the difference between means from bootstrap samples
dhats_boot = np.subtract(xbars_boot, ybars_boot)

ax = sns.histplot(dhats_boot, stat="density", bins=35, alpha=0.5)
ax.set_xlim(-20,45)
ax.set_ylabel(r"$f_{\widehat{D}^*}$");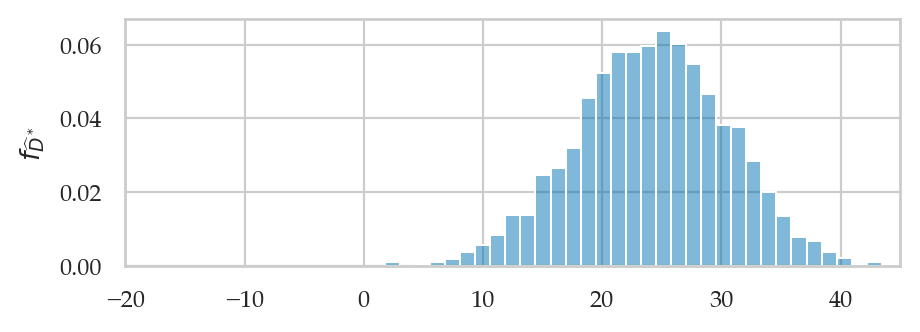
We can obtain the bootstrap estimate of the standard error by calculating the standard deviation of the bootstrap distribution.
np.std(dhats_boot)6.341245623022366Example 7: difference between electricity prices
Let’s return to Bob’s dataset of electricity prices collected from charging stations in the East and West parts of his city. We’ll assume the prices in the two parts of the city are normally distributed and described by the models and .
We have two samples and from these prices
eprices = pd.read_csv("datasets/eprices.csv")
pricesW = eprices[eprices["loc"]=="West"]["price"]
pricesE = eprices[eprices["loc"]=="East"]["price"]
np.mean(pricesW), np.mean(pricesE)(9.155555555555557, 6.155555555555556)dprice = dmeans(pricesW, pricesE)
dprice3.000000000000001# std and sample size in the East
stdW, nW = pricesW.std(), len(pricesW)
# std and sample size in the West
stdE, nE = pricesE.std(), len(pricesE)
stdW, nW, stdE, nE(1.5621388471508475, 9, 0.8776547030454391, 9)sehatDprice = np.sqrt(stdW**2/nW + stdE**2/nE)
sehatDprice0.5972674401486562dfDprice = calcdf(stdW, nW, stdE, nE)
dfDprice12.59281702723103from scipy.stats import t as tdist
rvTDprice = tdist(df=dfDprice, loc=dprice, scale=sehatDprice)
ax = plot_pdf(rvTDprice, rv_name="D", xlims=[-6,6], color="m")
ax.set_ylabel(r"$f_{T_{\widehat{D}}}$")
ax.set_xlabel(None);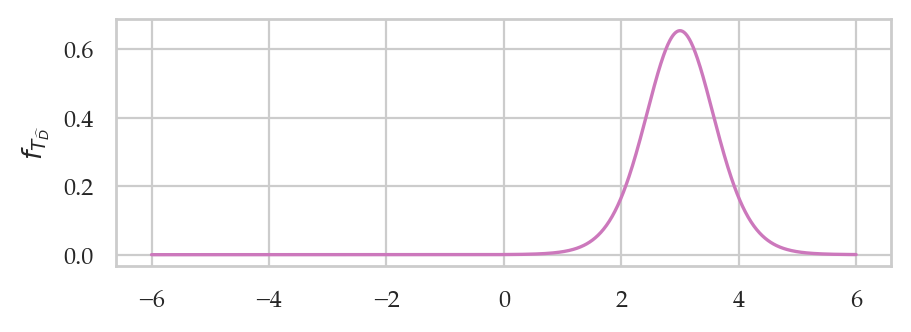
Bootstrapped sampling distribution of the difference between means
First compute bootstrap estimates for mean in each group
from ministats import gen_boot_dist
xbarsW_boot = gen_boot_dist(pricesW, estfunc=np.mean)
xbarsE_boot = gen_boot_dist(pricesE, estfunc=np.mean)Next we compute the difference between means from bootstrap samples
dprices_boot = np.subtract(xbarsW_boot, xbarsE_boot)
ax = sns.histplot(dprices_boot, stat="density", bins=30)
ax.set_xlim([-6,6])
# ax.set_xlabel("$\hat{d}$")
ax.set_ylabel(r"$f_{\widehat{D}^*}$");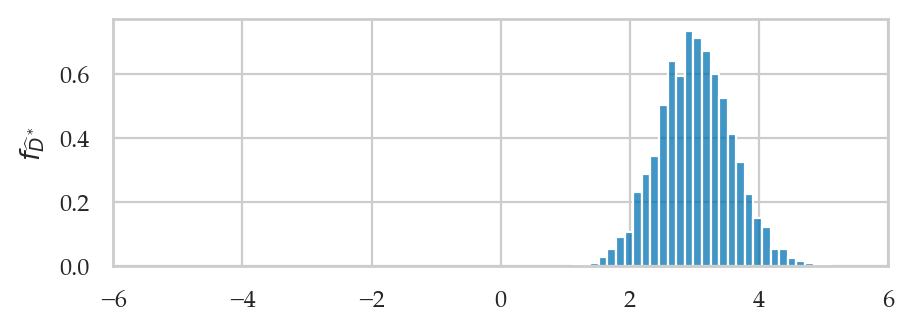
We can obtain the bootstrap estimate of the standard error by calculating the standard deviation of the bootstrap distribution.
np.std(dprices_boot)0.5653843908460382Note this value is very similar to the value that we obtained from the analytical approximation formula. This shows that the bootstrap procedure is a viable alternative to the calculation based on analytical approximations.
3.5.2 Confidence interval for the difference between means
Example 3: confidence interval for difference in electricity prices
eprices = pd.read_csv("datasets/eprices.csv")
pricesW = eprices[eprices["loc"]=="West"]["price"]
pricesE = eprices[eprices["loc"]=="East"]["price"]The difference between sample means is:
dprice = dmeans(pricesW, pricesE)
dprice3.000000000000001The estimate will be the center of the confidence interval.
Now let’s compute the parameters we need to know to calculate the standard error of the sampling distribution.
# sample size and std in West and East
stdW, nW = pricesW.std(), len(pricesW)
stdE, nE = pricesE.std(), len(pricesE)
stdW, nW, stdE, nE(1.5621388471508475, 9, 0.8776547030454391, 9)# standard error
sehatDprice = np.sqrt(stdW**2/nW + stdE**2/nE)
sehatDprice0.5972674401486562# degrees of freedom
from ministats import calcdf
dfDprice = calcdf(stdW, nW, stdE, nE)
dfDprice12.59281702723103from scipy.stats import t as tdist
# calculate the quantiles of the t-distribution
rvT = tdist(df=dfDprice)
t_05 = rvT.ppf(0.05)
t_95 = rvT.ppf(0.95)
# construct the confidence interval
[dprice + t_05*sehatDprice, dprice + t_95*sehatDprice][1.9396575883680864, 4.060342411631915]Bootstrap confidence interval
# compute bootstrap estimates for mean in each group
np.random.seed(42)
xbarsW_boot = gen_boot_dist(pricesW, estfunc=np.mean)
xbarsE_boot = gen_boot_dist(pricesE, estfunc=np.mean)
# compute the difference between means of bootstrap samples
dprices_boot = np.subtract(xbarsW_boot, xbarsE_boot)
# construct the confidence interval
[np.percentile(dprices_boot,5),
np.percentile(dprices_boot,95)][2.0666666666666655, 3.933888888888892]Reusable procedure
def ci_dmeans(xsample, ysample, alpha=0.1, method="a"):
"""
Compute confidence interval for the difference between population means.
- method="a" analytical approx. based on Student's t-dist
- method="b" approx. based on bootstrap estimation
"""
assert method in ["a", "b"]
if method == "a": # analytical approximation
stdX, n = np.std(xsample, ddof=1), len(xsample)
stdY, m = np.std(ysample, ddof=1), len(ysample)
dhat = np.mean(xsample) - np.mean(ysample)
seD = np.sqrt(stdX**2/n + stdY**2/m)
dfD = calcdf(stdX, n, stdY, m)
t_l = tdist(df=dfD).ppf(alpha/2)
t_u = tdist(df=dfD).ppf(1-alpha/2)
return [dhat + t_l*seD, dhat + t_u*seD]
elif method == "b": # bootstrap estimation
xbars_boot = gen_boot_dist(xsample, np.mean)
ybars_boot = gen_boot_dist(ysample, np.mean)
dhats_boot = np.subtract(xbars_boot,ybars_boot)
return [np.quantile(dhats_boot, alpha/2),
np.quantile(dhats_boot, 1-alpha/2)]
# ALT.
# from ministats import ci_dmeansEmpirical coverage probability evaluation
# Population data models X ~ N(120,13) and Y ~ N(100,17)
from scipy.stats import norm
muX, muY = 120, 100
sigmaX, sigmaY = 13, 17
rvX = norm(muX, sigmaX)
rvY = norm(muY, sigmaY)
# Sample sizes
n, m = 12, 15
# Set the random seed to a particular value to get a reproducible result
np.random.seed(42)
# Empirical coverage probability evaluation
# Empirical coverage probability evaluation
N = 100 # change to N=1000 for more accuracy
acount, bcount = 0, 0
for j in range(N):
xs = rvX.rvs(n)
ys = rvY.rvs(m)
cia = ci_dmeans(xs, ys, alpha=0.1, method="a")
if cia[0] <= muX - muY <= cia[1]:
acount += 1
cib = ci_dmeans(xs, ys, alpha=0.1, method="b")
if cib[0] <= muX - muY <= cib[1]:
bcount += 1
print("Coverage proportion of analytical approx. CIs:", acount/N)
print("Coverage proportion of bootstrap CIs:", bcount/N)Coverage proportion of analytical approx. CIs: 0.93
Coverage proportion of bootstrap CIs: 0.92
3.5.3 Permutation test for comparing two populations
The permutations test is a computational approach for comparing two group. The permutation test takes it’s name from the action of mixing up the group-membership labels and computing a statistic which is a way to generate samples from the null hypothesis in situations where the null hypothesis states there is no difference between two groups.
Permutations
np.random.seed(43)
np.random.permutation([1,2,3,4,5,6,7])array([4, 6, 3, 7, 2, 1, 5])np.random.seed(45)
np.random.permutation([1,2,3,4,5,6,7])array([6, 3, 2, 1, 5, 7, 4])Resampling under the null hypothesis
def resample_under_H0(xsample, ysample):
"""
Generate new samples from a random permutation of
the values in the samples `xsample` and `xsample`.
"""
values = np.concatenate((xsample, ysample))
pvalues = np.random.permutation(values)
pxsample = pvalues[0:len(xsample)]
pysample = pvalues[len(xsample):]
return pxsample, pysample# example 1
np.random.seed(43)
resample_under_H0([1,2,3], [4,5,6,7])(array([4, 6, 3]), array([7, 2, 1, 5]))# example 2
np.random.seed(45)
resample_under_H0([1,2,3], [4,5,6,7])(array([6, 3, 2]), array([1, 5, 7, 4]))The function resample_under_H0 gives us a way to generate samples from the null hypothesis.
We can then compute the value of the dmeans statistic for these samples. We used the assumption of “no difference” under the null hypothesis, and translated this to the “forget the labels” interpretation.
Example 5P: electricity prices
The probability model under the alternative hypothesis describes two populations with different parameters:
Under the null hypothesis the populations have the same mean:
eprices = pd.read_csv("datasets/eprices.csv")
epriceseprices.groupby("loc")["price"].describe()pricesW = eprices[eprices["loc"]=="West"]["price"]
pricesE = eprices[eprices["loc"]=="East"]["price"]
# 1. Calculate the observed difference between means
dprice = dmeans(pricesW, pricesE)
dprice3.000000000000001Our goal is to determine how likely or unlikely the observed value is under the null hypothesis . This means we need to obtain the sampling distribution of under , which we can do using the permutation test.
Let’s look at some of the differences we can expect to observe under .
#######################################################
np.random.seed(31)
# generate new samples by shuffling the labels
ppricesW, ppricesE = resample_under_H0(pricesW, pricesE)
# Compute the difference in means for the bootstrap samples
dprice0 = dmeans(ppricesW, ppricesE)
dprice01.6444444444444448Running a permutation test
We can repeat the resampling procedure 10000 times to get the sampling distribution of under ,
as illustrated in the code procedure below.
np.random.seed(42)
# 2. Obtain the sampling distribution under H0
P = 10000
dprices0 = []
for i in range(0, P):
ps1, ps2 = resample_under_H0(pricesW, pricesE)
dprice0 = dmeans(ps1, ps2)
dprices0.append(dprice0)ax = sns.histplot(dprices0, alpha=0.5)
ax.set_ylabel(r"$f_{\widehat{D}_0}$");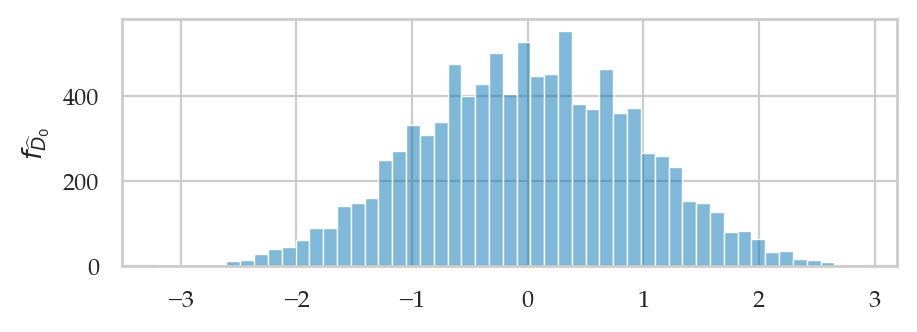
Now that we have the sampling distribution ,
we can see where the observed value =dprice falls within this distribution.
The -value is the probability of observing value dprice=3 or more extreme under the null hypothesis.
# 3. Compute the p-value
tails = tailvalues(dprices0, dprice, alt="two-sided")
pvalue = len(tails) / len(dprices0)
pvalue0.0002# plot the sampling distribution in blue
bins = nicebins(dprices0, dprice)
ax = sns.histplot(dprices0, bins=bins, alpha=0.5)
# plot red line for the observed statistic
plt.axvline(dprice, color="red")
# plot the values that are equal or more extreme in red
sns.histplot(tails, ax=ax, bins=bins, color="red")
ax.set_ylabel(r"$f_{\widehat{D}_0}$");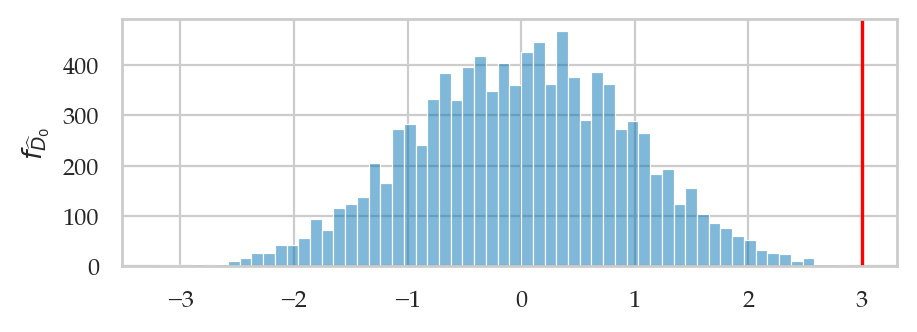
Effect size estimates
dprice = dmeans(pricesW, pricesE)
dprice3.000000000000001The bootstrap confidence interval for the effect size tells us a range of plausible values for the effect size.
from ministats import ci_dmeans
np.random.seed(45)
ci_dmeans(pricesW, pricesE, alpha=0.1, method="b")[2.0777777777777775, 3.9555555555555557]The 90% confidence interval describes an interval of numbers that should contain the difference between group means at least 90% of the time:
Reusable function
def permutation_test_dmeans(xsample, ysample, P=10000):
# 1. Compute the observed difference between means
obsdhat = dmeans(xsample, ysample)
# 2. Get sampling dist. of `dmeans` under H0
dhats0 = []
for i in range(0, P):
pxs, pys = resample_under_H0(xsample, ysample)
dhat0 = dmeans(pxs, pys)
dhats0.append(dhat0)
# 3. Compute the p-value
tails = tailvalues(dhats0, obsdhat, alt="two-sided")
pvalue = len(tails) / len(dhats0)
return pvaluenp.random.seed(42)
permutation_test_dmeans(pricesW, pricesE)0.0002Example 1P: permutation test on the known population
np.random.seed(56)
permutation_test_dmeans(xsample, ysample)0.0016# # Difference between means
# dhat = dmeans(xsample, ysample)
# # Obtain the sampling distribution under H0
# np.random.seed(56)
# pdhats0 = []
# for i in range(0, 10000):
# pxs, pys = resample_under_H0(xsample, ysample)
# pdhat0 = dmeans(pxs, pys)
# pdhats0.append(pdhat0)
# ax = sns.histplot(pdhats0, stat="density", bins=35, color="C1")
# plt.axvline(dhat, color="red")
# ax.set_xlim(-30,30);
# ax.set_ylabel("$f_{\\widehat{D}_0}$");
# # Compute the p-value
# tails = tailvalues(pdhats0, dhat, alt="two-sided")
# pvalue = len(tails) / len(pdhats0)
# print("p-value =", pvalue)# CHECK USING scipy.stats FUNCTION
from scipy.stats import permutation_test
np.random.seed(56)
pres = permutation_test([xsample,ysample], statistic=dmeans, n_resamples=10000)
pres.pvalue0.0021997800219978004Example 3P: lecture and debate curriculums
students = pd.read_csv("datasets/students.csv")
students.head(3)students.groupby("curriculum")["score"].describe()studentsD = students[students["curriculum"]=="debate"]
studentsL = students[students["curriculum"]=="lecture"]
scoresD = studentsD["score"]
scoresL = studentsL["score"]
# observed difference between score means
dscore = dmeans(scoresD, scoresL)
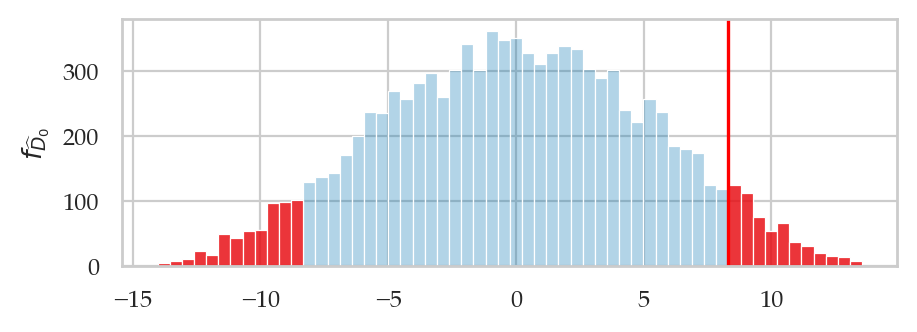
dscore8.319642857142867Our goal is to determine how likely or unlikely this observed value is under the null hypothesis . This means we need to obtain the sampling distribution of under , which we can do using the permutation test.
np.random.seed(43)
pvalue = permutation_test_dmeans(scoresD, scoresL)
pvalue0.1117# generate sampling distribution under H0
np.random.seed(43)
dscores0 = []
for i in range(10000):
ps1, ps2 = resample_under_H0(scoresD, scoresL)
dscore0 = dmeans(ps1, ps2)
dscores0.append(dscore0)
# plot the sampling distribution in blue
bins = nicebins(dscores0, dscore)
ax = sns.histplot(dscores0, bins=bins, alpha=0.3)
# plot red line for the observed statistic
plt.axvline(dscore, color="red")
# plot the values that are equal or more extreme in red
tails = tailvalues(dscores0, dscore, alt="two-sided")
print("pvalue =", len(tails)/len(dscores0) )
sns.histplot(tails, bins=bins, ax=ax, color="red")
ax.set_ylabel(r"$f_{\widehat{D}_0}$");pvalue = 0.1117
3.5.4 Analytical approximation methods
We’ll now look at another approach for computing the sampling distribution of the difference between means estimator, using an analytical approximations based on Student’s -distribution. This is called the “two-sample -test” and it is procedure most commonly taught approach in STATS 101 courses.
How likely or unlikely is the observed difference under the null hypothesis ?
Analytical approximations are math models for describing the sampling distribution under
Real sampling distributions: obtained by repeated sampling from
Analytical approximation: math model based on estimated parameters
Based on this assumption we can use the theoretical model for the difference between group means (we assumed the two unknown populations are normally distributed), we can obtain a closed form expression for the sampling distribution of .
In particular, the probability model for the two groups under are:
from which we can derive the model for :
In words, the sampling distribution of the difference between group means is normally distributed with mean and standard deviation , described by the formula:
The standard error of the difference between means depends on the variance of the two groups and . Recall we’ve seen this expression earlier in Section 3.1 and Section 3.2 as well.
Problem 1: the population variances and are unknown, and we only have the estimated variances and , which we calculated from the samples and .
Solution 1: use plug in estimate and We can obtain an approximation to the standard error of the difference between means estimator using the plug-in principle, which states we can use search-and-replace the population parameters and with the estimates and :
Problem 2: the estimated standard error tends to underestimate the true standard error , so when we use the basic normal model the approximation is off (not enough weight in the tails).
Solution 2: use Student’s -distribution. We can define a new model for the based on Student’s -distribution:
In words, the sampling distribution of the difference between group means can be modeled as Student’s -distribution with degrees of freedom, centered at 0, with scale parameter .
The degrees of freedom parameter, denoted (Greek letter nu) in equations (
dfin code) determines the “weight” in the tails of the distribution. It is computed by a complicated formula that depends on the sample sizes and , and the sample standard deviations and .
from ministats.book.figures import plot_panel_pvalue_D0_and_T0
plot_panel_pvalue_D0_and_T0();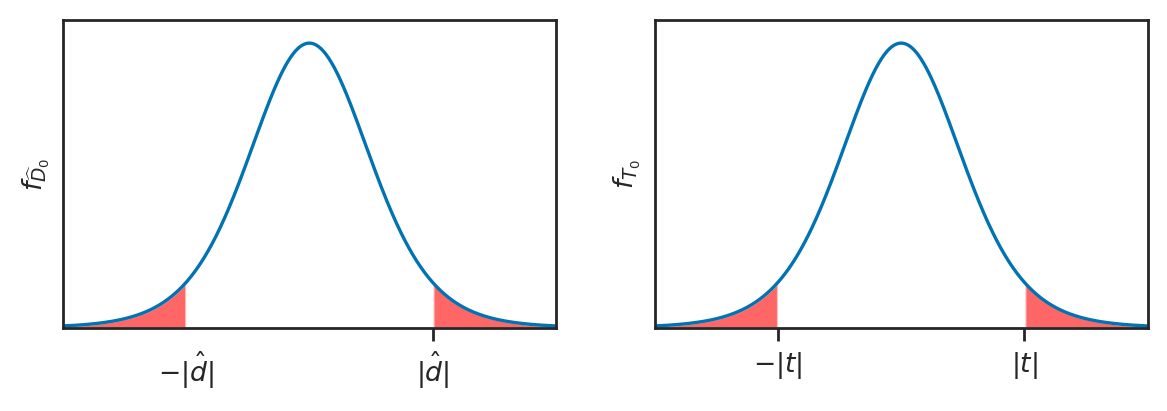
Example 5T: comparing East and West electricity prices
eprices = pd.read_csv("datasets/eprices.csv")
pricesW = eprices[eprices["loc"]=="West"]["price"]
pricesE = eprices[eprices["loc"]=="East"]["price"]
# Calculate the observed difference between means
dprice = dmeans(pricesW, pricesE)
dprice3.000000000000001Two-sample t-test
We’ll now show the data, probability modeling, and calculation steps of the "two-sample -test for comparing group means. The two-sample -test is also known as Welch’s t-test.
# Calculate the sample size and the standard deviation for each group
nW, nE = len(pricesW), len(pricesE)
stdW, stdE = np.std(pricesW,ddof=1), np.std(pricesE,ddof=1)# Compute the standard error of the estimator D
seDprice = np.sqrt(stdW**2/nW + stdE**2/nE)
seDprice0.5972674401486562# Compute the value of the t-statistic
obst = (dprice - 0) / seDprice
obst5.022875513276464from ministats import calcdf
# Obtain the degrees of freedom from the crazy formula
dfDprice = calcdf(stdW, nW, stdE, nE)
dfDprice12.59281702723103# Calculate the p-value
from scipy.stats import t as tdist
rvT0 = tdist(df=dfDprice)
from ministats import tailprobs
pvalue = tailprobs(rvT0, obst, alt="two-sided")
pvalue0.00025703383372176853# # SKIP BECAUSE TOO SMALL TO SEE
# _, ax = calc_prob_and_plot_tails(rvT0, -obst, obst, xlims=[-6,6])
# ax.set_title(None)
# ax.set_xlabel("$t$")
# ax.set_ylabel("$f_{T_0}$");Effect size estimates
dprice = dmeans(pricesW, pricesE)
dprice3.000000000000001The confidence interval for the effect size tells us a range of plausible values for the effect size.
from ministats import ci_dmeans

ci_dmeans(pricesW, pricesE, alpha=0.1, method="a")
[1.9396575883680864, 4.060342411631915]The 90% confidence interval describes an interval of numbers that should contain the difference between group means at least 90% of the time:
Reusable procedure for two-sample -test
def ttest_dmeans(xsample, ysample):
    # Calculate the observed difference between means
    obsdhat = np.mean(xsample) - np.mean(ysample)

    # Calculate the sample sizes and the stds
    n, m = len(xsample), len(ysample)
    sx, sy = np.std(xsample,ddof=1), np.std(ysample,ddof=1)

    # Calculate the standard error, the degrees of
    # freedom, the null model, and the t-statistic
    seD = np.sqrt(sx**2/n + sy**2/m)
    dfD = calcdf(sx, n, sy, m)
    obst = (obsdhat - 0) / seD

    # Calculate the p-value from the t-distribution
    rvT0 = tdist(df=dfD)
    pvalue = tailprobs(rvT0, obst, alt="two-sided")
    return pvalue
Verify we get the same -value when using the standard error formula.
ttest_dmeans(pricesW, pricesE)0.00025703383372176853Example 1T: two-sample -test with known populations
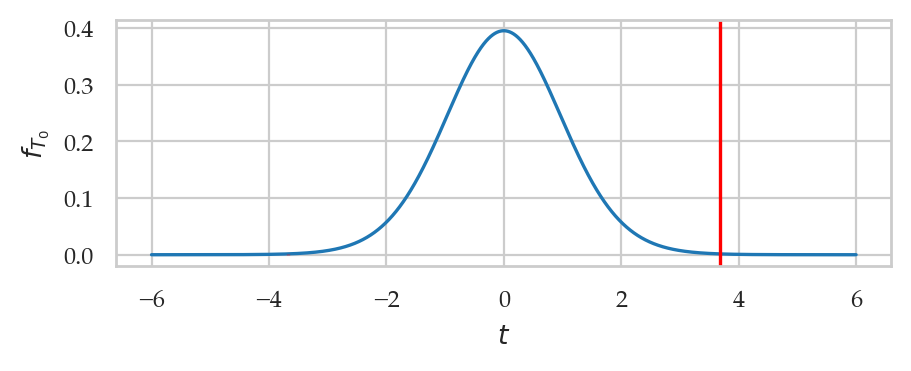
ttest_dmeans(xsample, ysample)0.0011643603109388243# DETAILS OF THE T-TEST ANALYSIS
dhat = dmeans(xsample, ysample)
stdX, stdY = np.std(xsample,ddof=1), np.std(ysample,ddof=1)
n, m = len(xsample), len(ysample)
sehatD = np.sqrt(stdX**2/n + stdY**2/m)
obst = (dhat - 0) / sehatD
print("obst =", obst)
from ministats import calcdf
dfD = calcdf(stdX, n, stdY, m)
rvT0 = tdist(df=dfD)
pvalue = tailprobs(rvT0, obst, alt="two-sided")
print("p-value =", pvalue)
from ministats import calc_prob_and_plot_tails
_, ax = calc_prob_and_plot_tails(rvT0, -obst, obst, xlims=[-6,6])
ax.set_title(None)
ax.set_xlabel("$t$")
ax.set_ylabel("$f_{T_0}$")
plt.axvline(obst, color="red");obst = 3.6759476463316196
p-value = 0.0011643603109388243
Example 6T: comparing rural and urban sleep scores
students = pd.read_csv("datasets/students.csv")
scoresD = students[students["curriculum"]=="debate"]["score"]
scoresL = students[students["curriculum"]=="lecture"]["score"]

# Observed difference between mean scores
dscores = dmeans(scoresD, scoresL)
dscores8.319642857142867ttest_dmeans(scoresD, scoresL)0.10307495448387399# T-TEST ANALYSIS
nD, nL = len(scoresD), len(scoresL)
stdD, stdL = np.std(scoresD,ddof=1), np.std(scoresL,ddof=1)
sehatDscore = np.sqrt(stdD**2/nD + stdL**2/nL)
obstDL = (dscores - 0) / sehatDscore
from ministats import calcdf
dfDscore = calcdf(stdD, nD, stdL, nL)
rvT0DL = tdist(df=dfDscore)
pvalueDL = tailprobs(rvT0DL, obstDL, alt="two-sided")
pvalueDL0.10307495448387399from ministats import calc_prob_and_plot_tails
_, ax = calc_prob_and_plot_tails(rvT0DL, -obstDL, obstDL, xlims=[-4,4])
ax.set_title(None)
ax.set_xlabel("$t$")
ax.set_ylabel("$f_{T_0}$");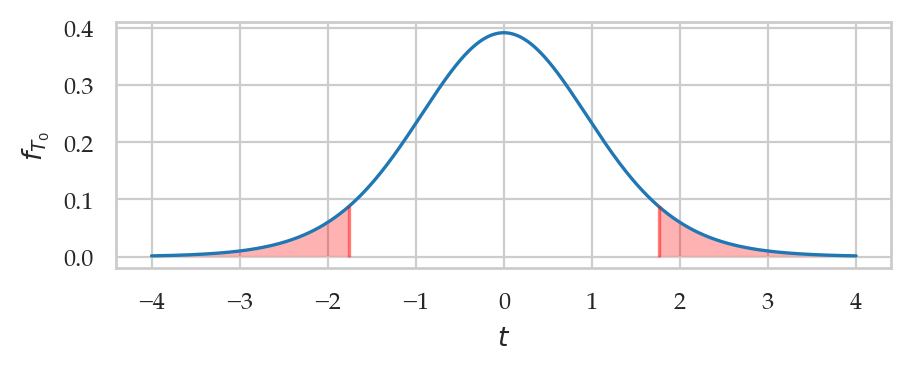
Alternative calculation methods
Example 5T revisited with pooled variance
# TODO make self contained# Compute the pooled variance and standard error of estimator D
varp = ((nW-1)*stdW**2 + (nE-1)*stdE**2) / (nW + nE - 2)
stdp = np.sqrt(varp)
sehatDp = stdp * np.sqrt(1/nW + 1/nE)
sehatDp0.5972674401486562# Compute the value of the t-statistic
obstp = (dprice - 0) / sehatDp
obstp5.022875513276464# Obtain the degrees of freedom
dfDp = nW + nE - 2
dfDp16from scipy.stats import t as tdist
from ministats import tailprobs
# Calculate the p-value
rvT0p = tdist(df=dfDp)
pvaluep = tailprobs(rvT0p, obstp, alt="two-sided")
pvaluep0.00012497067987674888Using scipy.stats for bootstrap confidence intervals
from scipy.stats import bootstrap

np.random.seed(47)
res = bootstrap([pricesW, pricesE], statistic=dmeans,
                confidence_level=0.9, n_resamples=5000,
                vectorized=False, method="percentile")
[res.confidence_interval.low,
 res.confidence_interval.high]
[2.0888888888888895, 3.9444444444444446]Note the result is the same as ...
Confidence intervals using statsmodels
import statsmodels.stats.api as sms

statsW = sms.DescrStatsW(pricesW)
statsE = sms.DescrStatsW(pricesE)
cm = sms.CompareMeans(statsW, statsE)
cm.tconfint_diff(alpha=0.1, usevar="unequal")
(1.9396575883680873, 4.060342411631915)Note the result is the same as ...
In the above code example, the functions sms.DescrStatsW compute the descriptive statistics
for the two samples, then sms.CompareMeans performs the comparison of means statistical analysis.
We call the method tconfint_diff to extract the 90% confidence interval from the result.
As you can see,
the numbers we obtain from the statsmodels
is exactly the same as the confidence interval we computed manually.
Using pinguouin to compute confidence intervals
import pingouin as pg

pg_res = pg.ttest(pricesW, pricesE, confidence=0.9, correction=True)
pg_res["CI90"].values[0]
array([1.93965759, 4.06034241])Using scipy.stats.permutation_test for permutation test
You can use the SciPy implementation of permutation test,
by calling the function permutation_test to perform a permutation test, then obtain the -value.
from scipy.stats import permutation_test

np.random.seed(42)

res2 = permutation_test([pricesW,pricesE], statistic=dmeans, n_resamples=10000)
res2.pvalue0.00019998000199980003Note the -value we obtained form the two methods may be different. This can happen when using the permutations test, because we use randomness as part of the calculation.
Using scipy.stats.ttest_ind for two-sample -tests
Alternatively,
we can use scipy.stats.ttest_ind to obtain the -value.
Use equal_var=False to obtain the Welsh value.
# ALT. compute using existing function in `scipy.stats`
from scipy.stats import ttest_ind
res3 = ttest_ind(pricesW, pricesE, equal_var=False)
res3.pvalue0.0002570338337217615Use equal_var=True to obtain the pooled variance value.
# ALT. compute using existing function in `scipy.stats`
from scipy.stats import ttest_ind
res3p = ttest_ind(pricesW, pricesE, equal_var=True)
res3p.pvalue0.00012497067987678515Using statsmodels for two-sample -tests
import statsmodels.stats.api as sms

statsW = sms.DescrStatsW(pricesW)
statsE = sms.DescrStatsW(pricesE)
cm = sms.CompareMeans(statsW, statsE)

# Welch's t-test
cm.ttest_ind(alternative="two-sided", usevar="unequal")
(5.022875513276465, 0.0002570338337217606, 12.592817027231032)# T-test with pooled variance
cm.ttest_ind(alternative="two-sided", usevar="pooled")(5.022875513276465, 0.00012497067987678515, 16.0)Explanations
Statistical modelling assumptions
INDEP:
NORMAL:
LARGEn:
EQVAR:
Standardized effect size
It is sometimes useful to report the effect size using a “standardized” measure for effect sizes.
Cohen’s is one such measure, and it is defined as the difference between two means divided by the pooled standard deviation.
where the pooled variance is defined as .
def cohend2(sample1, sample2):
    """
    Cohen's d measure of effect size for two independent samples.
    """
    n1, n2 = len(sample1), len(sample2)
    mean1, mean2 = np.mean(sample1), np.mean(sample2)
    var1, var2 = np.var(sample1,ddof=1), np.var(sample2,ddof=1)
    # Calculate the pooled variance and standard deviation
    var_pooled = ((n1-1)*var1+(n2-1)*var2) / (n1+n2-2)
    std_pooled = np.sqrt(var_pooled)
    d = (mean1 - mean2) / std_pooled
    return d
We interpret the value of Cohen’s using the reference table of values:
| Cohen’s d | Effect size |
|---|---|
| 0.01 | very small |
| 0.20 | small |
| 0.50 | medium |
| 0.80 | large |
Effect size for mean deviation of kombucha Batch 04 from expected value .
cohend2(pricesW, pricesE)2.367806224329099Exercises
See notebook sec35
Links
Permutation Methods: A Basis for Exact Inference by Michael D. Ernst
Nice animation https://
commons .wikimedia .org /wiki /File:Permutation _test _example _animation .gif
via Permutation test
CUT MATERIAL
Example sampling dist using pivotal transformation
Recall the sampling distribution of the difference between means rvTDprice.
Here are some examples of equivalent calculations using standard -distribution.
dfD = calcdf(stdW, nW, stdE, nE)
rvT = tdist(df=dfD)
rvTDprice.ppf(0.95), rvTDprice.ppf(0.95)*seD + dhat(4.060342411631915, 47.641013149955555)rvTDprice.cdf(4), rvTDprice.cdf( (4-dhat)/seD )(0.9406438830093703, 4.556607350244164e-08)NEW STUFF (TODO: merge with above)
TODO: distribute the following plots into appropriate subsections
Bootstrap approximation
from ministats import ci_dmeans
ci_dmeans(xsample,ysample, method="b")
[13.540768158298691, 34.5974768136927]Analytical approximation
ci_dmeans(xsample,ysample, method="a")[12.940807861945025, 35.44470301667319]Simulated sampling distribution under null
# CUT BECAUSE CONFUSING SINCE NEEDS A DIFFERENT, HYPOTHETICAL DATA MODEL
# # Two populations with the same mean X ~ N(100,13) and Y ~ N(100,17)
# from scipy.stats import norm
# muX0, muY0 = 100, 100
# sigmaX0, sigmaY0 = 13, 17
# rvX0 = norm(muX0, sigmaX0)
# rvY0 = norm(muY0, sigmaY0)

# # Two samples of sizes n=12 and m=15
# np.random.seed(55)
# n = 12
# x0sample = rvX0.rvs(n)

# np.random.seed(56)
# m = 15
# y0sample = rvY0.rvs(m)
# N = 10000
# dhats0 = []
# for j in range(0,N):
# x0sample = rvX0.rvs(n)
# y0sample = rvY0.rvs(m)
# dhat0 = dmeans(x0sample, y0sample)
# dhats0.append(dhat0)
# sns.histplot(dhats0, alpha=0.5);Sampling distribution from the permutation test
from scipy.stats import permutation_test

dhat = dmeans(xsample, ysample)

np.random.seed(42)
pres = permutation_test([xsample,ysample], statistic=dmeans, n_resamples=10000)
ax = sns.histplot(pres.null_distribution, stat="density", bins=35, color="C1")
plt.axvline(dhat, color="red")
ax.set_xlim(-30,30);
ax.set_ylabel("$f_{\\widehat{D}_0}$");
pres.pvalue
0.0011998800119988001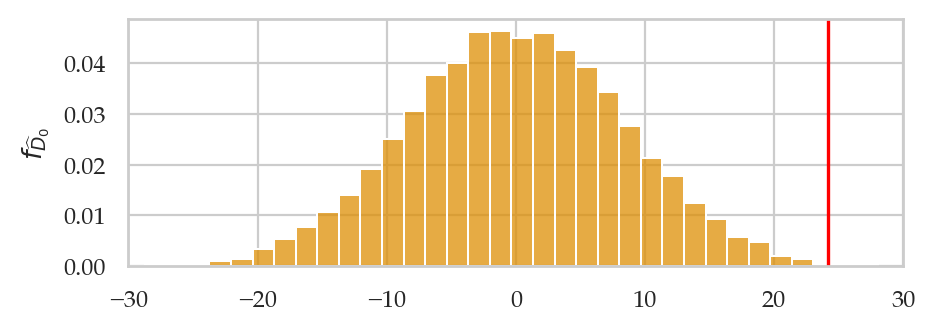
# np.random.seed(45)
from ministats import permutation_test_dmeans
permutation_test_dmeans(xsample, ysample)0.0022Sampling distribution from analytical approximation
# Sample statistics
dhat = dmeans(xsample, ysample)
stdX, stdY = np.std(xsample,ddof=1), np.std(ysample,ddof=1)

# Estimated standard error
sehatD = np.sqrt(stdX**2/n + stdY**2/m)

# Degrees of freedom, the null model, and the t-statistic
dfD = calcdf(stdX, n, stdY, m)

# Calculate the p-value from the t-distribution
rvDhat = tdist(df=dfD, loc=0, scale=sehatD)
ax = plot_pdf(rvDhat, color="C1")
plt.axvline(dhat, color="red")
ax.set_xlim(-30, 30);
ax.set_xlabel("")
ax.set_ylabel("$f_{\\widehat{D}_0}$");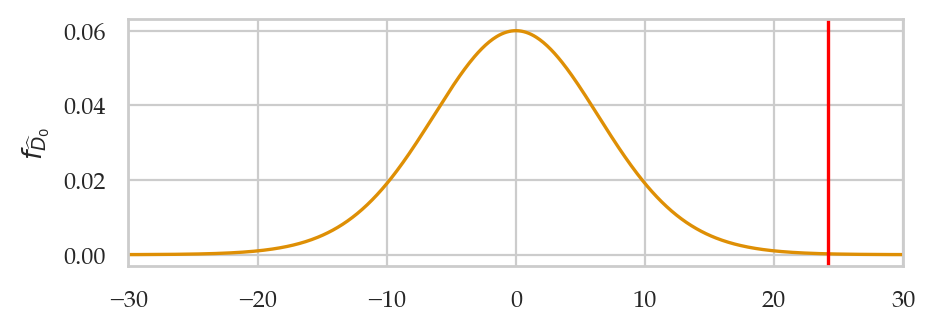
from ministats import ttest_dmeans
ttest_dmeans(xsample, ysample)
0.0011643603109388243