This notebook contains the code examples from Section 3.7 Inventory of statistical tests from the No Bullshit Guide to Statistics.
Notebook setup
# Ensure required Python modules are installed
%pip install --quiet numpy scipy seaborn pandas ministats
Note: you may need to restart the kernel to use updated packages.
# load Python modules
import numpy as np
import pandas as pd
import seaborn as sns
import matplotlib.pyplot as plt
# Plot helper functions
from ministats import plot_pdf# Figures setup
plt.clf() # needed otherwise `sns.set_theme` doesn't work
sns.set_theme(
context="paper",
style="whitegrid",
palette="colorblind",
rc={"font.family": "serif",
"font.serif": ["Palatino", "DejaVu Serif", "serif"],
"figure.figsize": (10, 3)},
)
%config InlineBackend.figure_format = 'retina'<Figure size 640x480 with 0 Axes># Simple float __repr__
if int(np.__version__.split(".")[0]) >= 2:
np.set_printoptions(legacy='1.25')
# set random seed for repeatability
np.random.seed(42)# Download datasets/ directory if necessary
from ministats import ensure_datasets
ensure_datasets()datasets/ directory already exists.
Definitions
Assumptions
Normality assumption
Here is a useful function for generating synthetic data to use with the parametric tests below.
import numpy as np
from scipy.stats import norm

def gen_normal_samples(mus=[0], sigmas=[1], ns=[30], seed=None):
    """
    Generate random samples of sizes `ns` from the normal data model
    with parameters taken from `mus` and `sigmas`.
    """
    if seed is not None:
        np.random.seed(seed)

    samples = []
    for mu, sigma, n in zip(mus, sigmas, ns):
        rvN = norm(mu, sigma)
        sample = rvN.rvs(n)
        samples.append(sample)

    return samples
NHST procedure
Categorization of statistical test recipes
Z-Tests
One-sample -test
See the examples
Proportion tests
One-sample -test for a proportion
k = 3
n = 5

p0 = 0.3

phat = k / n
se = np.sqrt( p0 * (1-p0) / n)


z = (phat - p0) / se
print("z =", z)

from scipy.stats import norm

rvZ0 = norm(0,1)
pvalue = rvZ0.cdf(-abs(z)) + (1 - rvZ0.cdf(abs(z)))
pvalue
z = 1.4638501094227998
0.14323490752466972from statsmodels.stats.proportion import proportions_ztest
proportions_ztest(k, n, value=p0, prop_var=p0)(1.4638501094227996, 0.1432349075246697)Confidence interval
alpha = 0.1
sehat = np.sqrt( phat * (1-phat) / n)

[phat + rvZ0.ppf(alpha/2)*sehat, phat + rvZ0.ppf(1-alpha/2)*sehat ]
[0.23963062588979633, 0.9603693741102035]from statsmodels.stats.proportion import proportion_confint
proportion_confint(k, n, alpha=0.1)(0.23963062588979633, 0.9603693741102036)Binomial test
cf. Binomial test
# Exact probability model for the sum of `n` Bernoulli events
from scipy.stats import binom
rvP0 = binom(n=5, p=p0)

# Probability of the observed outcome k
kprob = rvP0.pmf(k)

allks = np.arange(0,5+1) # array of all possible outcomes
probs = rvP0.pmf(allks)  # probabilities of all outcomes

# Compute the sum of the prob of all outcomes
# that have less probability than observed outcome.
pvalue = np.sum(probs[probs<=kprob])
pvalue0.16307999999999992from scipy.stats import binomtest
binres = binomtest(k, n, p=p0)
binres.pvalue0.16308from statsmodels.stats.proportion import binom_test
binom_test(k, n, prop=p0)0.16308Two-sample -test for proportions
Welch’s two-sample -test
Student’s two-sample -test
(explain pooled variance as special case “Two sample t-test”, but inferior)
Paired -test
Chi-square tests
Chi-square test for goodness of fit
Example: are the digits of random?
pidigits = [99959,  99757, 100026, 100230, 100230, 100359,  99548,  99800, 99985, 100106]
# obtained using   np.bincount(list(str(sympy.N(sympy.pi, 1_000_000)).replace('.','')))

os = pidigits           # observed
es = [1_000_000/10]*10  # expected (uniform)

from scipy.stats import chisquare
res = chisquare(f_obs=os, f_exp=es)
res.statistic, res.pvalue
(5.51852, 0.7869706202650394)See original blog post for useful historical context about this
https://
Example: birds foraging
Bird foraging behavior was investigated in an old-growth forest of Oregon. In the forest, 44% of the canopy volume was Douglas fir, 24% was ponderosa pine, 29% was grand fir, and 3% was western larch. The authors observed the behavior of several species of birds, one of which was the red-breasted nuthatch. They made 189 observations of this species foraging, recording 43 of observations in Douglas fir, 52 in ponderosa pine, 54 in grand fir, and 40 in western larch.
Using a chi-square test, we can test the null hypothesis that the proportions of foraging events are equal to the proportions of canopy volume. Considered a -value less than 1% to be significant.
cf. https://
import numpy as np

# Observed counts
os = np.array([43, 52, 54, 40])
n = np.sum(os)

# Expected counts based on canopy volume proportions
es = n * np.array([0.44, 0.24, 0.29, 0.03])

# Run the chi-square test for goodness of fit
from scipy.stats import chisquare
res = chisquare(f_obs=os, f_exp=es)
res.statistic, res.pvalue
(228.23515947653874, 3.3295585338846486e-49)Chi-square test of independence
Example 1: starting from counts
# rows: category of X
# columns: category of Y
observed = np.array([
    [30, 20, 10],
    [20, 30, 40],
])

from scipy.stats import chi2_contingency
res = chi2_contingency(observed, correction=False)
res.statistic, res.dof, res.pvalue
(16.666666666666668, 2, 0.00024036947641951404)# Compute by manually calculating expected frequencies under H0
n = observed.sum()
y_marginal = observed.sum(axis=0) / n
x_marginal = observed.sum(axis=1) / n
expected = n * x_marginal[:,np.newaxis] * y_marginal
# And degrees of freedom
dof = observed.size - sum(observed.shape) + 1 # = I*K - K - I + 1
from scipy.stats import chisquare
res = chisquare(f_obs=observed, f_exp=expected,
axis=None, ddof=observed.size - 1 - dof)
res.statistic, res.pvalue(16.666666666666668, 0.00024036947641951404)Example 2: starting from categorical observations
x = ["A", "A", "A", "A", "A", "A", "A", "A", "A", "A", "A", "A",
     "B", "B", "B", "B", "B", "B", "B", "B", "B", "B", "B", "B",]
y = ["yes", "yes", "yes", "yes", "yes", "yes", "yes", "yes", "no",  "no",  "no",  "no",
     "yes", "yes", "yes", "yes", "no",  "no",  "no",  "no",  "no",  "no",  "no",  "no",]

import pandas as pd
observed2 = pd.crosstab(x, y)
print(observed2)

from scipy.stats import chi2_contingency
res2 = chi2_contingency(observed2, correction=False)
res2.statistic, res2.dof, res2.pvalue
col_0 no yes
row_0
A 4 8
B 8 4
(2.6666666666666665, 1, 0.10247043485974996)import statsmodels.api as sm
table = sm.stats.Table(observed2, shift_zeros=False)
res2alt = table.test_nominal_association()
res2alt.statistic, res2alt.df, res2alt.pvalue(2.6666666666666674, 1, 0.10247043485974905)Chi-square test for homogeneity
import numpy as np
from scipy.stats import chi2_contingency

# rows: populations
# columns: categories of the outcome
observed3 = np.array([
    [30, 50, 20],   # population 1
    [45, 40, 15],   # population 2
    [25, 45, 30],   # population 3
])

res3 = chi2_contingency(observed3, correction=False)
res3.statistic, res3.dof, res3.pvalue
(12.995726495726496, 4, 0.011296693934973229)Chi-square test for the population variance
Analysis of variance (ANOVA) tests
One-way analysis of variance (ANOVA)
Example: doctors workplace
doctors = pd.read_csv("datasets/doctors.csv")
hos_scores = doctors[doctors["work"]=="hos"]["score"]
cli_scores = doctors[doctors["work"]=="cli"]["score"]
eld_scores = doctors[doctors["work"]=="eld"]["score"]

# One-way ANOVA
from scipy.stats import f_oneway
res = f_oneway(hos_scores, cli_scores, eld_scores)
res.pvalue0.5526627461285655sns.pointplot(data=doctors, x="work", y="score", hue="work");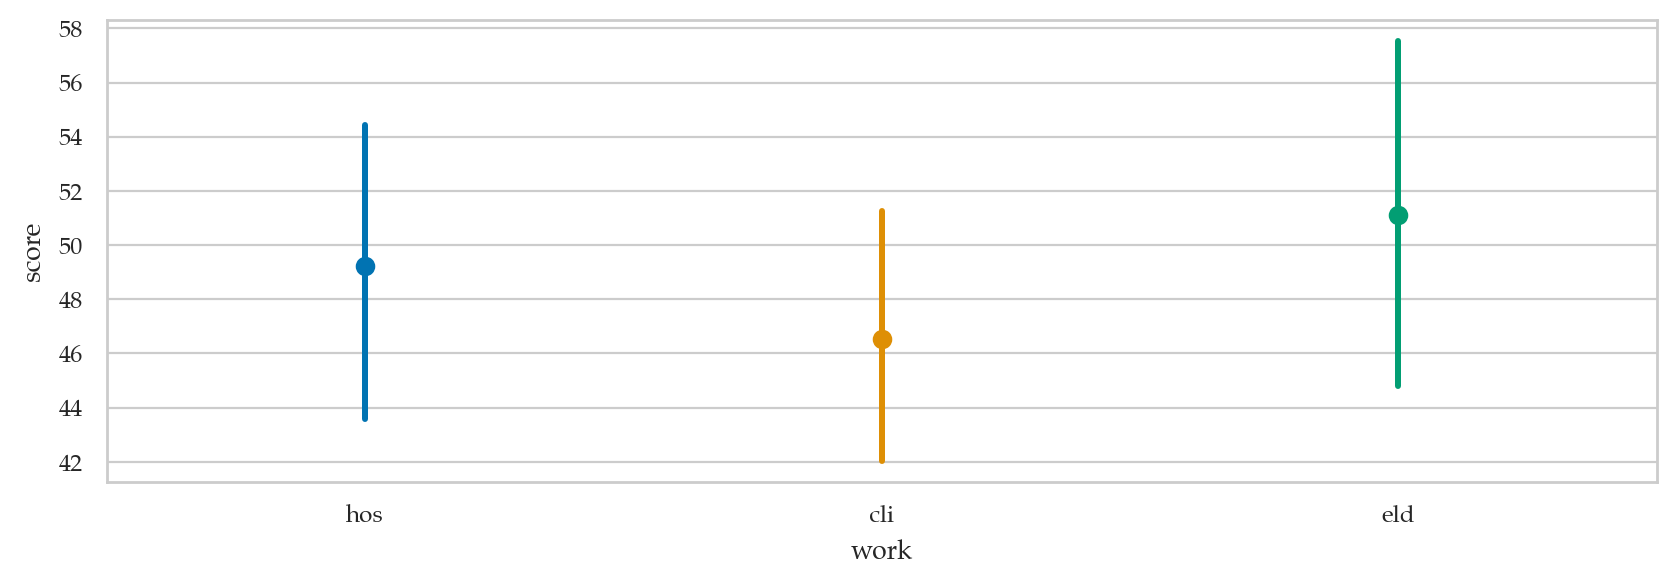
Example: synthetic dataset with one group differenrt
mus = [100, 100, 104]
sigmas = [5, 5, 5]
ns = [20, 20, 20]
samples = gen_normal_samples(mus=mus, sigmas=sigmas, ns=ns, seed=46)
[sample1, sample2, sample3] = samples

# One-way ANOVA
from scipy.stats import f_oneway
res = f_oneway(sample1, sample2, sample3)
res.pvalue0.002268927763807039Correctly rejects .
Example: synthetic dataset with all groups roughly the same
mus = [99.5, 100, 100.5]
sigmas = [5, 5, 5]
ns = [20, 20, 20]
samples = gen_normal_samples(mus=mus, sigmas=sigmas, ns=ns, seed=47)
[sample1, sample2, sample3] = samples

# One-way ANOVA
from scipy.stats import f_oneway
res = f_oneway(sample1, sample2, sample3)
res.pvalue0.22426174367680077Correctly fails to reject .
Nonparametric tests
Use when assumptions for other tests not valid
Sign test for the population median
via https://
from scipy.stats import binomtest

n_pos = 6
n_neg = 9
n_min = min(n_pos, n_neg)
n_tot = n_pos + n_neg

# Calculate p-value (two-tailed) using the binomial test
binomtest(k=n_min, n=n_tot, p=0.5, alternative='two-sided')
BinomTestResult(k=6, n=15, alternative='two-sided', statistic=0.4, pvalue=0.6072387695312499)n_max = max(n_pos, n_neg)
binomtest(k=n_max, n=n_tot, p=0.5, alternative='two-sided')BinomTestResult(k=9, n=15, alternative='two-sided', statistic=0.6, pvalue=0.6072387695312499)One-sample Wilcoxon signed-rank test
Mann-Whitney U-test
example via https://
# dfw = pd.read_csv("https://reneshbedre.github.io/assets/posts/mann_whitney/genotype.csv")
# dfw.shape
# dfw
# from scipy.stats import mannwhitneyu
# mannwhitneyu(x=dfw["A"], y=dfw["B"], alternative="two-sided")Kruskal-Wallis analysis of variance by ranks
Resampling methods
Simulation tests
from ministats.hypothesis_tests import simulation_test

%psource simulation_test
def simulation_test(sample, rvH0, estfunc, alt="two-sided"):
"""
Compute the p-value of the observed estimate `estfunc(sample)` under H0
described by the random variable `rvH0`.
"""
# 1. Compute the observed value of `estfunc`
obsest = estfunc(sample)
n = len(sample)
# 2. Get sampling distribution of `estfunc` under H0
sampl_dist_H0 = gen_sampling_dist(rvH0, estfunc, n)
# 3. Compute the p-value
tails = tailvalues(sampl_dist_H0, obsest, alt=alt)
pvalue = len(tails) / len(sampl_dist_H0)
return pvalue
Two-sample permutation test
from ministats.hypothesis_tests import permutation_test

%psource permutation_test
def permutation_test(xsample, ysample, estfunc, P=10000):
"""
Compute the p-value of the observed estimate `estfunc(xsample,ysample)`
under the null hypothesis where the group membership is randomized.
"""
# 1. Compute the observed value of `estfunc`
obsest = estfunc(xsample, ysample)
# 2. Get sampling dist. of `estfunc` under H0
pestimates = []
for i in range(0, P):
rsx, rsy = resample_under_H0(xsample, ysample)
pestimate = estfunc(rsx, rsy)
pestimates.append(pestimate)
# 3. Compute the p-value
tails = tailvalues(pestimates, obsest)
pvalue = len(tails) / len(pestimates)
return pvalue
Permutation ANOVA
from ministats.estimators import Fstat

%psource Fstat
def Fstat(*samples):
I = len(samples)
n = len(np.concatenate(samples))
xbar = np.mean(np.concatenate(samples))
SSbetween = sum(len(xi)*(np.mean(xi) - xbar)**2 for xi in samples)
SSwithin = sum(np.sum((xi - np.mean(xi))**2) for xi in samples)
MSbetween = SSbetween / (I - 1)
MSwithin = SSwithin / (n - I)
return MSbetween / MSwithin
from ministats import permutation_anova

%psource permutation_anova
def permutation_anova(samples, P=10000, alt="greater"):
"""
Compute the p-value of the observed F-statistic for `samples` list
under the null hypothesis where the group membership is randomized.
"""
ns = [len(sample) for sample in samples]
# 1. Compute the observed F-statistic
obsfstat = Fstat(*samples)
# 2. Get sampling dist. of F-statistic under H0
pfstats = []
for i in range(0, P):
values = np.concatenate(samples)
pvalues = np.random.permutation(values)
psamples = []
nstart = 0
for nstep in ns:
psample = pvalues[nstart:nstart+nstep]
psamples.append(psample)
nstart = nstart + nstep
pfstat = Fstat(*psamples)
pfstats.append(pfstat)
# 3. Compute the p-value
tails = tailvalues(pfstats, obsfstat, alt=alt)
pvalue = len(tails) / len(pfstats)
return pvalue
# test on three samples
from scipy.stats import norm

# Random samples
np.random.seed(43)
sample1 = norm(loc=0).rvs(size=30)
sample2 = norm(loc=0).rvs(size=30)
sample3 = norm(loc=0.7).rvs(size=30)

from ministats.estimators import Fstat
print("F =", Fstat(sample1, sample2, sample3))

np.random.seed(45)
permutation_anova([sample1, sample2, sample3])
F = 3.6808227678358847
0.0297from ministats.estimators import Fstat
np.random.seed(45)
from scipy.stats import permutation_test
res = permutation_test([sample1,sample2,sample3], statistic=Fstat, alternative='greater')
res.statistic, res.pvalue(3.6808227678358847, 0.0298)# compare with analytical formula
from scipy.stats import f_oneway
res = f_oneway(sample1, sample2, sample3)
res.statistic, res.pvalue(3.6808227678358865, 0.029206733498721386)Equivalence tests
See examples