This notebook contains the code examples from Section 3.2 Confidence intervals of the No Bullshit Guide to Statistics. Use the “rocket” icon at the top-right to make the code cells interactive (Live Code), or run this notebook an ephemeral JupyterLab cloud instance (Binder).
Notebook setup
%pip install -q numpy scipy seaborn pandas ministatsNote: you may need to restart the kernel to use updated packages.
# load Python modules
import os
import numpy as np
import pandas as pd
import seaborn as sns
import matplotlib.pyplot as plt
# Plot helper functions
from ministats import plot_pdf# Figures setup
plt.clf() # needed otherwise `sns.set_theme` doesn't work
sns.set_theme(
context="paper",
style="whitegrid",
palette="colorblind",
rc={"font.family": "serif",
"font.serif": ["Palatino", "DejaVu Serif", "serif"],
"figure.figsize": (6, 1.4)},
)
%config InlineBackend.figure_format = 'retina'<Figure size 640x480 with 0 Axes># Download datasets/ directory if necessary
from ministats import ensure_datasets
ensure_datasets()datasets/ directory already exists.
# Simple float __repr__
if int(np.__version__.split(".")[0]) >= 2:
    np.set_printoptions(legacy='1.25')

# set random seed for repeatability
np.random.seed(42)
(this cell contains the macro definitions like , , , ...)
Definitions
Review of estimators
Recall all the estimators (functions that take samples as inputs) we defined in the previous section.
def mean(sample):
    return sum(sample) / len(sample)

def var(sample):
    xbar = mean(sample)
    sumsqdevs = sum([(xi-xbar)**2 for xi in sample])
    return sumsqdevs / (len(sample)-1)

def std(sample):
    s2 = var(sample)
    return np.sqrt(s2)
Interpreting confidence intervals
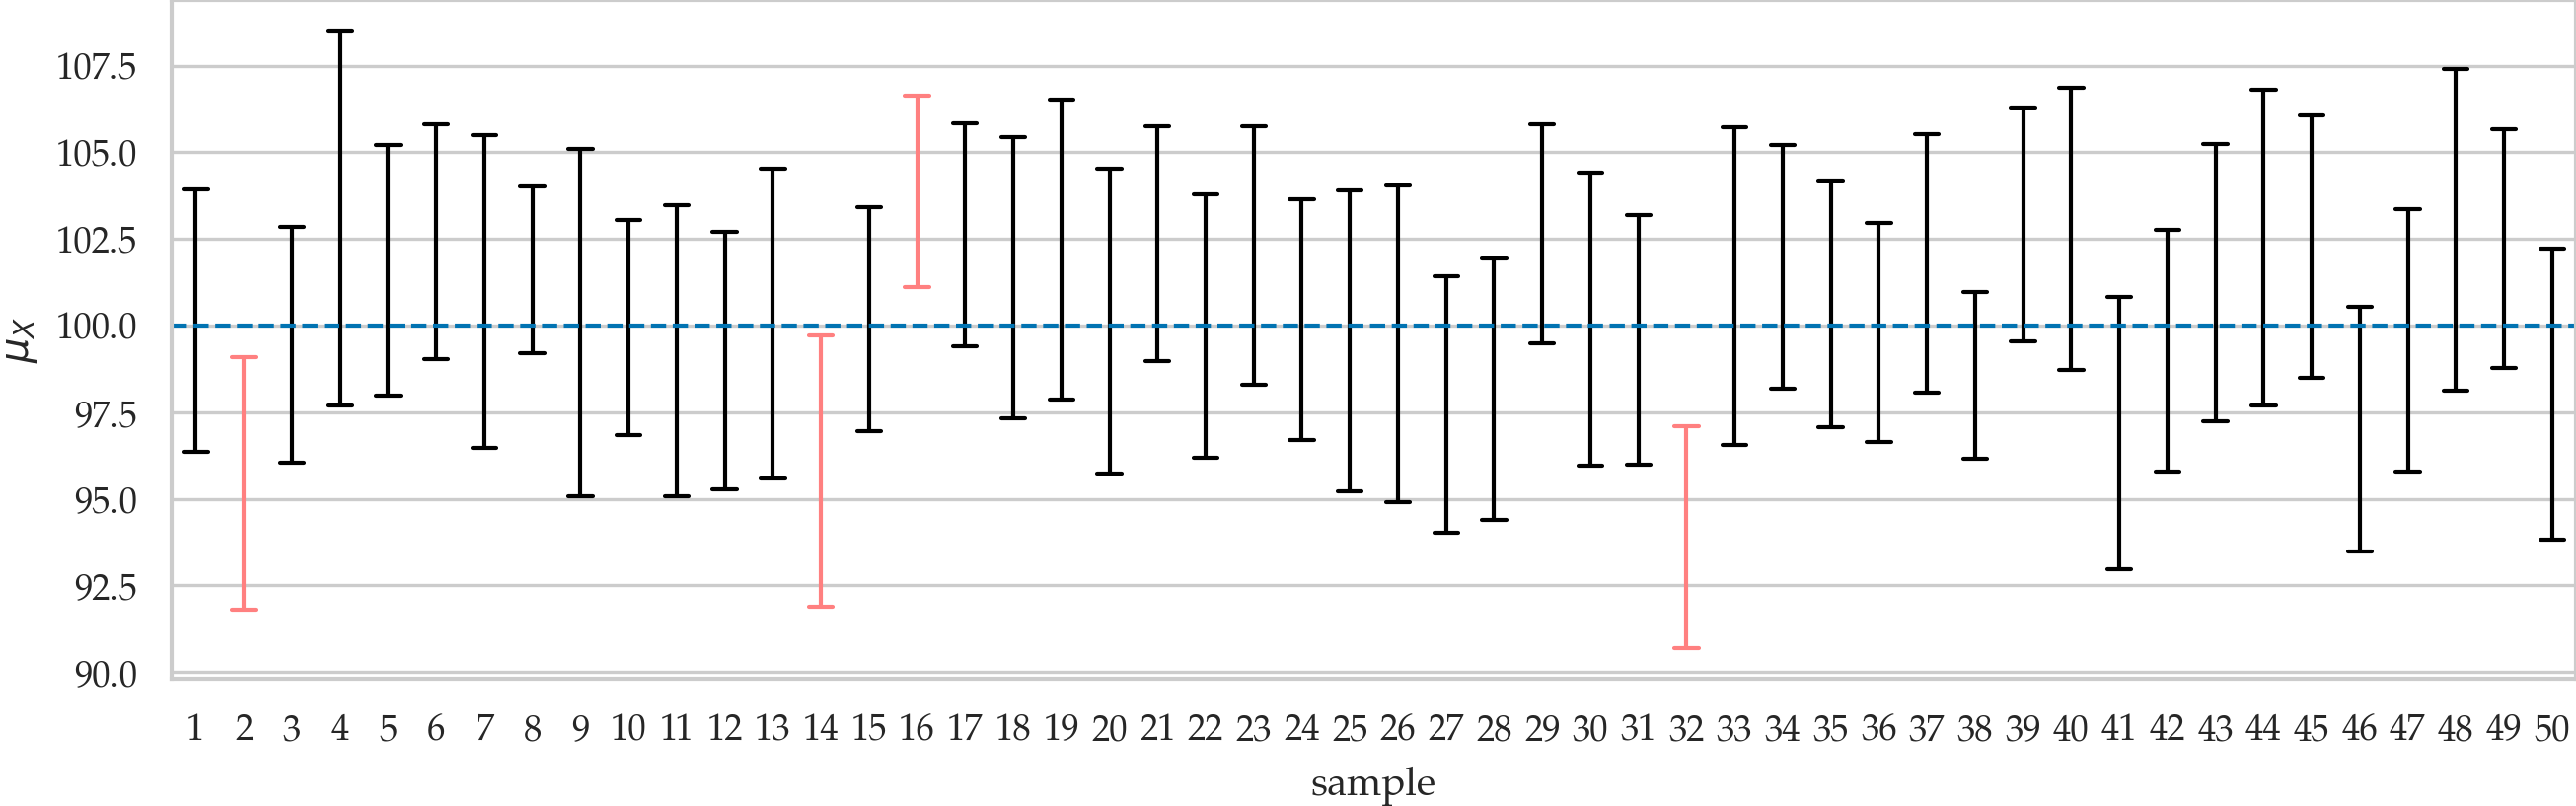
Illustration of 90% confidence intervals for the population mean. The plot shows confidence intervals , , , , , which we computed from 50 different samples of size taken from the population . The true population mean is . Intervals that don’t include are drawn in light red.
Confidence interval constructions
Ingredients:
knowledge of the sampling distribution of the estimator
knowledge of the inverse cumulative distribution function (inverse-CDF) of the sampling distributions
Procedure:
calculate the -quantile, , and the -quantile, of the sampling distribution
use a pivotal quantity to convert the quantiles of the sampling distribution and obtain the lower bound and upper bounds of the confidence interval
Recall the two methods for approximating sampling distributions: analytical approximation formulas (based on probability distributions) and the bootstrap estimation procedure (based on computation), which we learned in Section 3.1. We’ll now learn how to compute confidence intervals based on these approximation methods.
from ministats.book.figures import plot_confidence_interval
plot_confidence_interval();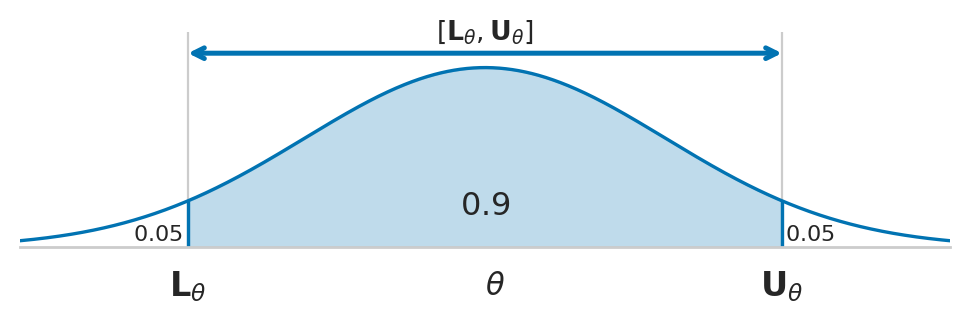
Bootstrap confidence intervals
np.random.seed(42)
xsample = [1,2,3,4,5]
mean(xsample)3.0from ministats import gen_boot_dist
xbars_boot = gen_boot_dist(xsample, estfunc=mean, B=100)
xbars_boot[0:5] # first five bootstrap means[4.4, 3.2, 3.6, 3.2, 2.6][np.percentile(xbars_boot,5), np.percentile(xbars_boot,95)][1.8, 4.2][np.quantile(xbars_boot,0.05), np.quantile(xbars_boot,0.95)][1.8, 4.2]from scipy.stats import norm
rvZ = norm(loc=0, scale=1)
z_u = rvZ.ppf(0.95)
z_u1.644853626951472rvZ = norm(0, 1)
z_u = rvZ.ppf(0.95)
z_u1.644853626951472Default parameters
rvZ = norm()
z_u = rvZ.ppf(0.95)
z_u1.644853626951472Class methods
z_u = norm.ppf(0.95, loc=0, scale=1)
z_u1.644853626951472z_u = norm.ppf(0.95)
z_u1.644853626951472Construct 90% confidence interval for the Z distribution
alpha = 0.1
z_l = norm.ppf(alpha/2)
z_u = norm.ppf(1-alpha/2)
[z_l, z_u]
[-1.6448536269514729, 1.644853626951472]Other standard reference distributions
Just call class method, since by default loc=0 and scale=1.
# 95th percentile of the t distribution
from scipy.stats import t as tdist
rvT = tdist(df=6, loc=0, scale=1)
rvT.ppf(0.95)1.9431802805153042# 95th percentile of the chi-square distribution
from scipy.stats import chi2
rvQ = chi2(df=6, loc=0, scale=1)
rvQ.ppf(0.95)12.591587243743977Confidence interval for the population mean
To build a confidence interval, we first calculate the and quantiles of Student’s -distribution:
from ministats import plot_conf_int
from scipy.stats import t as tdist

rvT = tdist(df=9)
plot_conf_int(rvT, alpha=0.1, rv_name="T");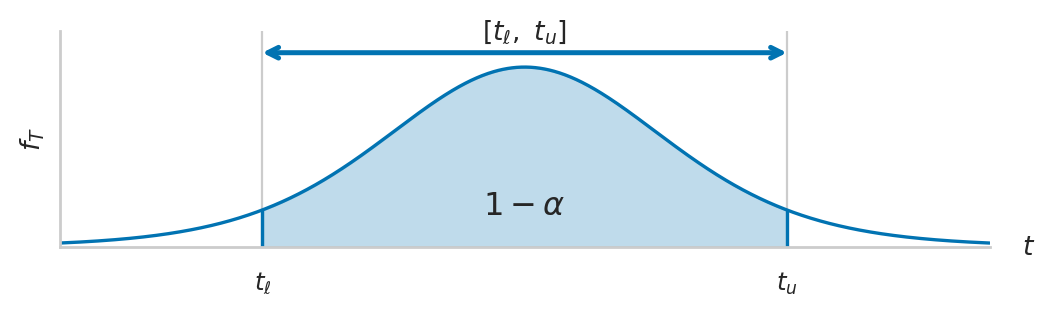
Example 1: confidence interval for the mean apple weight
apples = pd.read_csv("datasets/apples.csv")
asample = apples["weight"]
asample.values
array([205., 182., 192., 189., 217., 192., 210., 240., 225., 191., 193.,
209., 167., 183., 210., 198., 239., 188., 179., 182., 200., 197.,
245., 192., 201., 218., 198., 211., 208., 217.])The sample mean is:
abar = mean(asample)
abar202.6Analytical confidence interval for the mean
n = len(asample)
n30sehatAbar = std(asample) / np.sqrt(n)
sehatAbar3.3959407817427336from scipy.stats import t as tdist
rvT = tdist(df=n-1)
t_05 = rvT.ppf(0.05)
t_95 = rvT.ppf(0.95)
[abar + t_05*sehatAbar, abar + t_95*sehatAbar][196.82986523723363, 208.37013476276636]We would normally report this interval as without too many decimals.
Bootstrap confidence interval for the mean
np.random.seed(50)

# generate the bootstrap distribution of the mean
abars_boot = gen_boot_dist(asample, estfunc=mean)

# construct the confidence interval
[np.percentile(abars_boot,5), np.percentile(abars_boot,95)]
[197.23333333333332, 208.26666666666668]Reusable procedure
def ci_mean(sample, alpha=0.1, method="a"):
    """
    Compute confidence interval for the population mean.
    - method="a" analytical approx. based on Student's t-dist
    - method="b" approx. based on bootstrap estimation
    """
    assert method in ["a", "b"]
    if method == "a":        # analytical approximation
        from scipy.stats import t as tdist
        n = len(sample)
        xbar = np.mean(sample)
        sehat = np.std(sample, ddof=1) / np.sqrt(n)
        t_l = tdist(df=n-1).ppf(alpha/2)
        t_u = tdist(df=n-1).ppf(1-alpha/2)
        return [xbar + t_l*sehat, xbar + t_u*sehat]
    elif method == "b":          # bootstrap estimation
        xbars_boot = gen_boot_dist(sample, estfunc=mean)
        return [np.quantile(xbars_boot, alpha/2),
                np.quantile(xbars_boot, 1-alpha/2)]

# ALT.
# from ministats import ci_mean
Verify coverage probability
np.random.seed(42)

N = 100  # change to N=1000 for more accuracy
n = 20

from scipy.stats import norm
muK = 1000
sigmaK = 10
rvK = norm(muK, sigmaK)

acount, bcount = 0, 0
for j in range(0, N):
    ksample = rvK.rvs(n)
    cia = ci_mean(ksample, alpha=0.1, method="a")
    if cia[0] <= muK <= cia[1]:
        acount += 1
    cib = ci_mean(ksample, alpha=0.1, method="b")
    if cib[0] <= muK <= cib[1]:
        bcount += 1

print("Coverage proportion of analytical approx. CIs:", acount / N)
print("Coverage proportion of bootstrap CIs:", bcount / N)
Coverage proportion of analytical approx. CIs: 0.89
Coverage proportion of bootstrap CIs: 0.86
Confidence interval for the population variance
from ministats import plot_conf_int
from scipy.stats import chi2

rvX2 = chi2(df=5)
plot_conf_int(rvX2, alpha=0.1, rv_name="Q");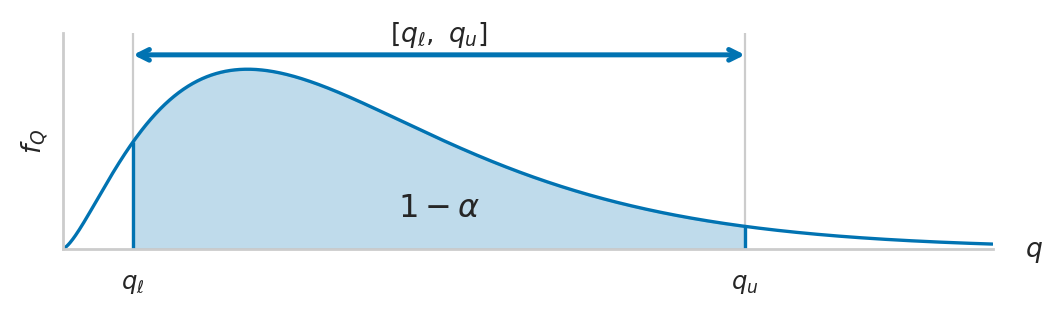
Example 2: confidence interval for the variance of apple weights
apples = pd.read_csv("datasets/apples.csv")
asample = apples["weight"]
n = len(asample)
n30s2 = var(asample)
s2345.9724137931035from scipy.stats import chi2
rvX2 = chi2(df=n-1, loc=0, scale=1)
q_05 = rvX2.ppf(0.05)
q_95 = rvX2.ppf(0.95)
[(n-1)*s2/q_95, (n-1)*s2/q_05][235.75927791988897, 566.5796548600426]Bootstrap confidence interval for the variance
np.random.seed(53)

# generate the bootstrap distribution of the variance
avars_boot = gen_boot_dist(asample, estfunc=var)

# construct the confidence interval
[np.percentile(avars_boot,5),
 np.percentile(avars_boot,95)]
[196.387816091954, 480.82183908046]Reusable procedure
def ci_var(sample, alpha=0.1, method="a"):
    """
    Compute confidence interval for the population variance.
    - method="a" analytical approx. based on chi-square dist
    - method="b" approx. based on bootstrap estimation
    """
    assert method in ["a", "b"]
    if method == "a":        # analytical approximation
        n = len(sample)
        s2 = np.var(sample, ddof=1)
        q_l = chi2(df=n-1).ppf(alpha/2)
        q_u = chi2(df=n-1).ppf(1-alpha/2)
        return [(n-1)*s2/q_u, (n-1)*s2/q_l]
    elif method == "b":          # bootstrap estimation
        vars_boot = gen_boot_dist(sample, estfunc=var)
        return [np.quantile(vars_boot, alpha/2),
                np.quantile(vars_boot, 1-alpha/2)]

# ALT.
# from ministats import ci_var
Verify coverage probability
np.random.seed(42)

N = 100  # change to N=1000 for more accuracty
n = 20

from scipy.stats import norm
muK = 1000
sigmaK = 10
rvK = norm(muK, sigmaK)

acount, bcount = 0, 0
for j in range(0, N):
    ksample = rvK.rvs(n)
    cia = ci_var(ksample, alpha=0.1, method="a")
    if cia[0] <= sigmaK**2 <= cia[1]:
        acount += 1
    cib = ci_var(ksample, alpha=0.1, method="b")
    if cib[0] <= sigmaK**2 <= cib[1]:
        bcount += 1

print("Coverage proportion of analytical approx. CIs:", acount/N)
print("Coverage proportion of bootstrap CIs:", bcount/N)
Coverage proportion of analytical approx. CIs: 0.89
Coverage proportion of bootstrap CIs: 0.81
Alternative calculation methods
Using scipy.stats.bootstrap for confidence intervals
One-sample bootstrap confidence interval
from scipy.stats import bootstrap

np.random.seed(50)
res = bootstrap([asample], statistic=mean,
                confidence_level=0.9, n_resamples=5000,
                vectorized=False, method="percentile")
[res.confidence_interval.low,
 res.confidence_interval.high]
[197.23333333333332, 208.26666666666668]Note the result is the same as ...
Using the function scipy.stats.bootstrap requires lots of keyword arguments,
because it is a very powerful tool you can use for all kinds of bootstrap calculations.
Let’s go over the arguments one by one:
Instead of giving the input
asampledirectly as the first argument, we pass in a list of length one[asample]which tells the function that we want a single-sample calculationstatistic: specify the estimator we want to compute confidence interval forconfidence_level: the confidence leveln_resamples: the number of bootstrap samples we want to generatevectorized=False: turns off vectorized inputs, which is a performance optimization that we don’t need for this calculationmethod="percentile": select the percentile bootstrap method, as opposed to one of the other bootstrap methods that are available
The bootstrap function returns a result object. We can access the attributes of this object to obtain the limits of the confidence interval. Note the result is identical to the bootstrap estimate we obtained from the function gen_boot_dist followed by np.percentile calculations.
Using statsmodels for confidence intervals
The Python libraries statsmodels, scipy.stats, and pingouin
provide predefined functions for computing confidence intervals.
We’ll now show some of these “alternative computations”
based on predefined functions so you’ll learn a little bit
about the tools for statistical analysis that are available to you.
We’ll also use these alternative computations to confirm that the calculations we did from first principles are correct.
Note however these are “optional” reading materials, and you can skip
any code cells that start with an # ALT comment without loss of generality.
import statsmodels.stats.api as sms
sms.DescrStatsW(asample).tconfint_mean(alpha=0.1)
(196.82986523723363, 208.37013476276636)As you can see,
the numbers we obtain from the statsmodels
is exactly the same as the confidence interval we computed manually.
Using pingouin for confidence intervals
import pingouin as pg

pg.compute_bootci(asample, func=mean,
                  confidence=0.9, n_boot=5000,
                  method="per", seed=50)
array([197.27, 208.3 ])Note the results are the same as ...
Explanations
One-sided confidence intervals
# TODO add code examplePoint and interval estimates
terminology...
Frequentist interpretation
Guarantees for confidence intervals given in terms of , the expectation over a random sample . These guarantees can be interpreted as long-term average error rates if the statistical procedure were performed many times (frequentist paradigm). Note in the frequentist paradigm gives no guarantee about any specific confidence interval—only gives guarantee about the performance of the procedure we used for computing the CIs.
Assumptions
condensed mention of: (full discussion of assumptions in Sec 3.4) Parametric model assumption (conceptual) cf. nonparametric methods
(NORM): the population is normally distributed (normality test)
(LARGEn): the sample size is “large enough” for approximate normality
(EQVAR): the variance in two groups is the same
Discussion
Misconceptions about confidence intervals
See main text.
Comparing analytical formulas and bootstrap estimates
See main text.
Advanced bootstrap methods
Mention more advanced bootstrap methods like BCa exist (--> see problem PZZ)
# BCa = Bias-Corrected accelerated mean
from scipy.stats import bootstrap

np.random.seed(53)
res = bootstrap([asample], statistic=mean,
                confidence_level=0.9, n_resamples=5000,
                vectorized=False, method="bca")

# sns.histplot(res.bootstrap_distribution, bins=30)

[res.confidence_interval.low,
 res.confidence_interval.high]
[197.6, 208.46666666666664]# BCa = Bias-Corrected accelerated var
from scipy.stats import bootstrap
np.random.seed(53)
res = bootstrap([asample], statistic=var,
confidence_level=0.9, n_resamples=5000,
vectorized=False, method="bca")
# sns.histplot(res.bootstrap_distribution, bins=30)
[res.confidence_interval.low,
res.confidence_interval.high][231.29845557680545, 541.41793330525]This interval is very close to the analytical approximation we obtained in terms of the chi-square reference distribution .
Evaluation of confidence interval methods
Rows:
uniform
norm
slightly skewed
very skewed
bimodal
Column groups:
coverage probability
average width
Cols:
analytical approx
percentile bootstrap
BCa
from scipy.stats import uniform, norm, lognorm, expon
from ministats.probs import mixnorms

# different populations to use for simulation
POPULATIONS = {
    "Z": norm(),
    "U": uniform(),
    "S": lognorm(s=0.3),
    "E": expon(loc=0, scale=1/5),
    "B": mixnorms(locs=[3,6.2], scales=[1,1], weights=[0.4,0.6]),
}

METHODS = [
    "a",           # analytical approximation
    "percentile",  # percentile bootstrap
    "bca",         # bias-corrected accelerated bootstrap
]
fig, axs = plt.subplots(2, 2, figsize=(7,4))
# Uniform
rvU = POPULATIONS["U"]
plot_pdf(rvU, ax=axs[0,0], xlims=[-0.1, 1.1], rv_name="U")
axs[0,0].set_ylim(0,1.5)
axs[0,0].set_title("(a) Uniform", fontsize=12)
# Log-normal
rvS = POPULATIONS["S"]
plot_pdf(rvS, ax=axs[0,1], rv_name="S")
axs[0,1].set_title("(b) Log-normal", fontsize=12)
# Exponential
rvE = POPULATIONS["E"]
plot_pdf(rvE, ax=axs[1,0], rv_name="E")
axs[1,0].set_title(r"(c) Exponential", fontsize=12)
# Exponential
rvB = POPULATIONS["B"]
plot_pdf(rvB, ax=axs[1,1], xlims=[-1,11], rv_name="B")
axs[1,1].set_title(r"(d) Bimodal", fontsize=12)
fig.tight_layout()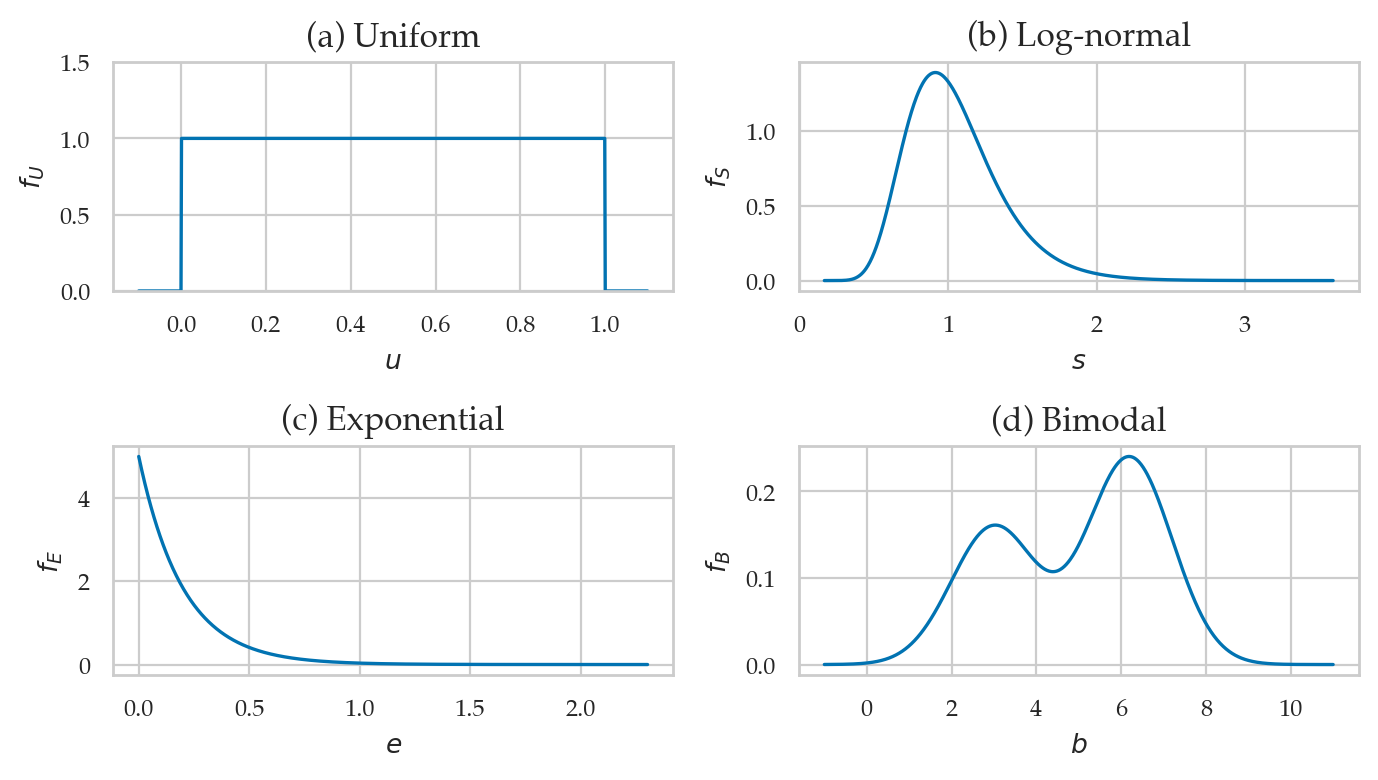
Coverage probabilities for population mean
# Download simdata/ directory if necessary
from ministats import ensure_simdata
ensure_simdata()
simdata/ directory present and ready.
from ministats.simulations import simulate_ci_props
results_mean = simulate_ci_props(POPULATIONS, methods=METHODS,
                                  ns=[20,40], param="mean",
                                  alpha=0.1, N=10000, seed=42)

results_mean.round(3)
# print(results_mean.to_latex(float_format="%.3f"))
loaded cached results from simdata/simulate_ci_props_mean__ns_20_40__alpha_0.1__seed_42.csv
Coverage probabilities for population variance
from ministats.simulations import simulate_ci_props
results_var = simulate_ci_props(POPULATIONS, methods=METHODS,
                                ns=[20,40], param="var",
                                alpha=0.1, N=10000, seed=43)

results_var.round(3)
# print(results_var.to_latex(float_format="%.3f"))
loaded cached results from simdata/simulate_ci_props_var__ns_20_40__alpha_0.1__seed_43.csv