This notebook contains the code examples from Section 3.1 Estimators of the No Bullshit Guide to Statistics. Use the “rocket” icon at the top-right to make the code cells interactive (Live Code), or run this notebook an ephemeral JupyterLab cloud instance (Binder).
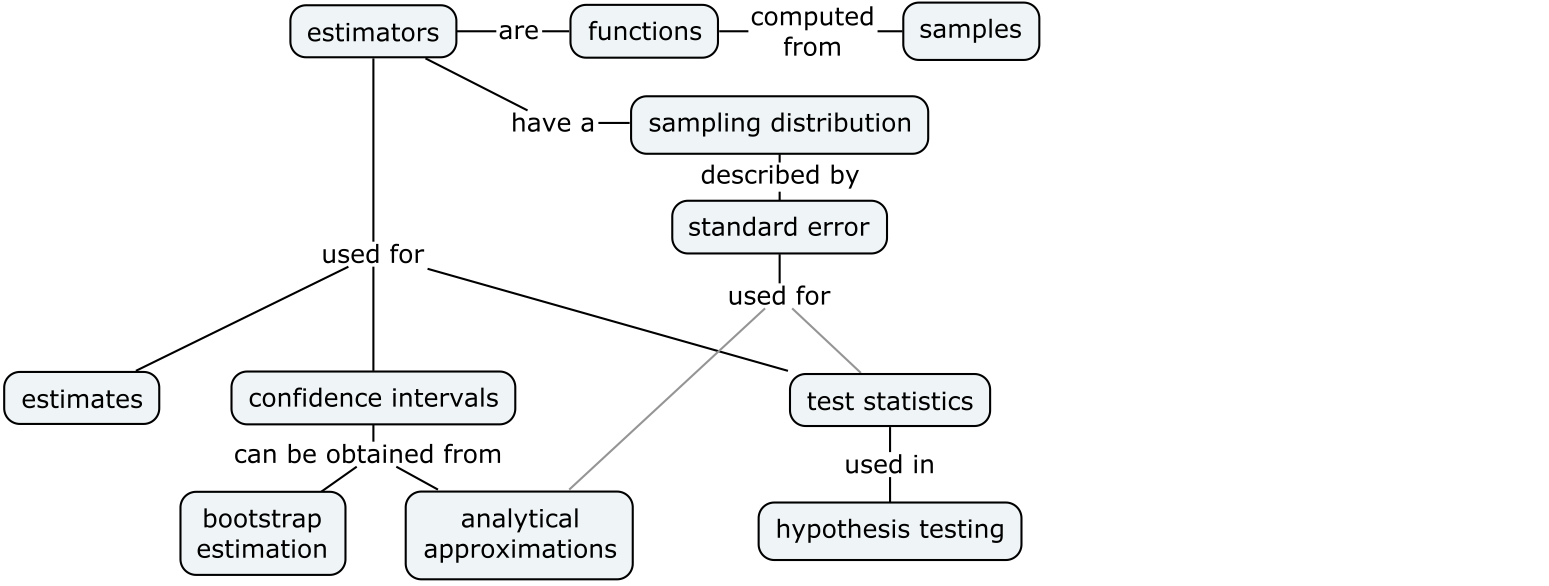
We’ll begin our study of inferential statistics by introducing estimators, which are the math tools used for computing confidence intervals and running hypothesis tests.
Notebook setup
# Ensure required Python modules are installed
%pip install --quiet numpy scipy seaborn pandas ministats
Note: you may need to restart the kernel to use updated packages.
# load Python modules
import os
import numpy as np
import pandas as pd
import matplotlib.pyplot as plt
import seaborn as sns
# Plot helper functions
from ministats import plot_pdf# Figures setup
plt.clf() # needed otherwise `sns.set_theme` doesn't work
sns.set_theme(
context="paper",
style="whitegrid",
palette="colorblind",
rc={"font.family": "serif",
"font.serif": ["Palatino", "DejaVu Serif", "serif"],
"figure.figsize": (7, 2)},
)
%config InlineBackend.figure_format = 'retina'
# Useful colors
snspal = sns.color_palette()
blue, orange, purple = snspal[0], snspal[1], snspal[4]<Figure size 640x480 with 0 Axes># Simple float __repr__
if int(np.__version__.split(".")[0]) >= 2:
np.set_printoptions(legacy='1.25')
# set random seed for repeatability
np.random.seed(42)# Download datasets/ directory if necessary
from ministats import ensure_datasets
ensure_datasets()datasets/ directory already exists.
(this cell contains the macro definitions like , , , ...)
Applications of sampling distributions
Parameter estimates
Confidence intervals (next section)
Test statistics (remainder of the sections in this chapter)
Definitions
Review of data concepts
To get things started, let’s review the data analysis concepts:
Population: the entire group of individuals we’re interested in. We generally assume it’s impossible to collect measurements for the entire population, because it consists of thousands or millions of individuals.
Sample : a sequence of observations from the population. Each corresponds to a measurement from one individual randomly selected from the population.
Sample statistic: any quantity computed from the sample .
Descriptive statistics: numerical summaries that describe the characteristics of the sample . Example of descriptive statistics include, the sample mean , the sample variance , and the sample standard deviation .
Review of probability concepts
Let’s review the main concepts and the notation we used to describe probability models:
: the population probability model describes the variability of the data in the population as a random variable with probability distribution .
: the model family describes the general “shape” of the distribution. Examples of probability model families include the uniform , the normal , and the exponential .
: the model parameters that describe the specific population. Examples of model parameters: and for uniform models, and for normal models, and for exponential models.
: the computer model of the random variable .
Random sample : a sequence of observations from the population model. Each is an independent copy of the random variable .
New concepts
Building on the DATA and PROB definitions, we can now introduce the notation and terminology around estimators:
Estimate : a statistic computed from the sample for the purpose of making inferences about a population parameter . For example, the sample mean is an estimate of the population mean .
Estimator : the function that we use to compute the estimate from a given sample . We denote this as . For example, the estimator is defined as the function . We use the estimator to compute the sample mean estimate .
The sampling distribution of the estimator is denoted and describes the estimates we can expect to observe from random samples from the population . For example, the sampling distribution of the mean is the random variable .
The standard error of an estimator is denoted and describes the standard deviation of its sampling distribution. For example, the standard error of the mean is denoted .
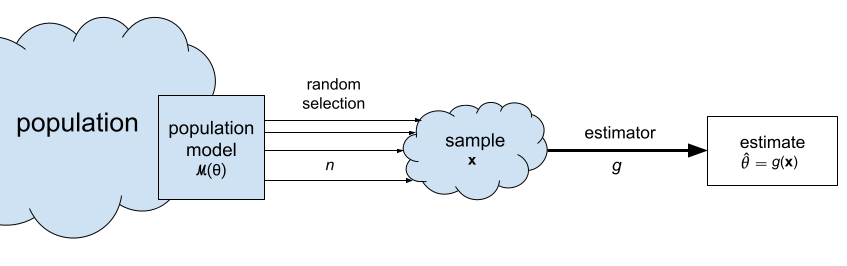
Statistical inference is the use the values of the statistics obtained from the sample to estimate the population parameters . For example, the sample mean is an estimate of the population mean , and the sample variance is an estimate of the population variance .
Estimators
Let’s start with some estimators you’re already familiar with (discussed in descriptive statistics):
Sample mean estimator
estimator:
gives an estimate for the population mean
def mean(sample):
    return sum(sample) / len(sample)

# ALT. use .mean() method on a pandas series
# ALT. use np.mean(sample)
Sample variance and standard deviation
estimator:
gives an estimate for the population variance
note the denominator is and not
def var(sample):
    xbar = mean(sample)
    sumsqdevs = sum([(xi-xbar)**2 for xi in sample])
    return sumsqdevs / (len(sample)-1)

# ALT. use .var() method on a pandas series
# ALT. use np.var(sample, ddof=1)
The standard deviation is the square root of the sample variance:
We can now define a Python function std for computing the standard deviation by taking the square root of the variance:
def std(sample):
    s2 = var(sample)
    return np.sqrt(s2)

# ALT. use .std() method on a pandas series
# ALT. use np.std(sample, ddof=1)
Example 1: apple weight mean and variance
apples = pd.read_csv("datasets/apples.csv")
asample = apples["weight"]
len(asample)30asample.head(3)0 205.0
1 182.0
2 192.0
Name: weight, dtype: float64type(asample)pandas.Series# asampletype(asample.values)numpy.ndarrayasample.valuesarray([205., 182., 192., 189., 217., 192., 210., 240., 225., 191., 193.,
209., 167., 183., 210., 198., 239., 188., 179., 182., 200., 197.,
245., 192., 201., 218., 198., 211., 208., 217.])sns.histplot(asample, bins=10);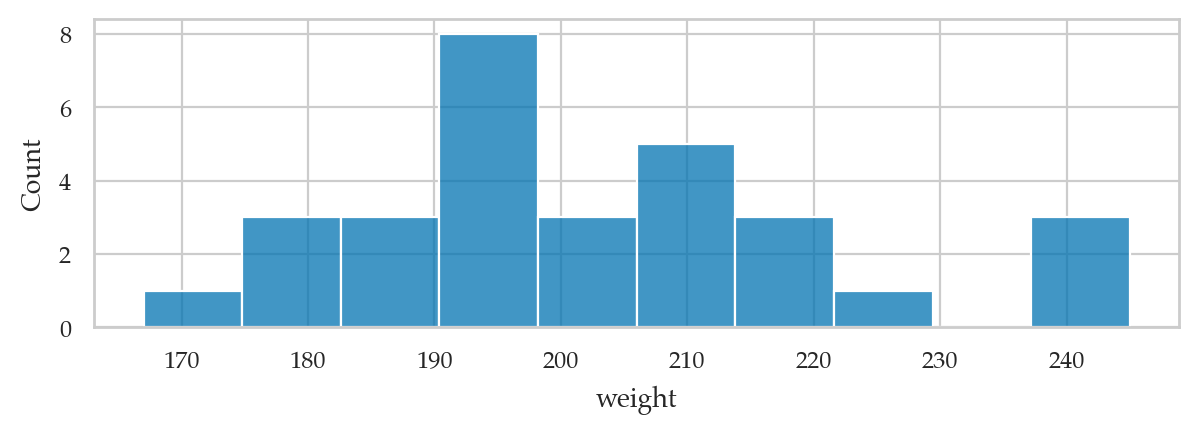
sns.kdeplot(asample, bw_adjust=0.3);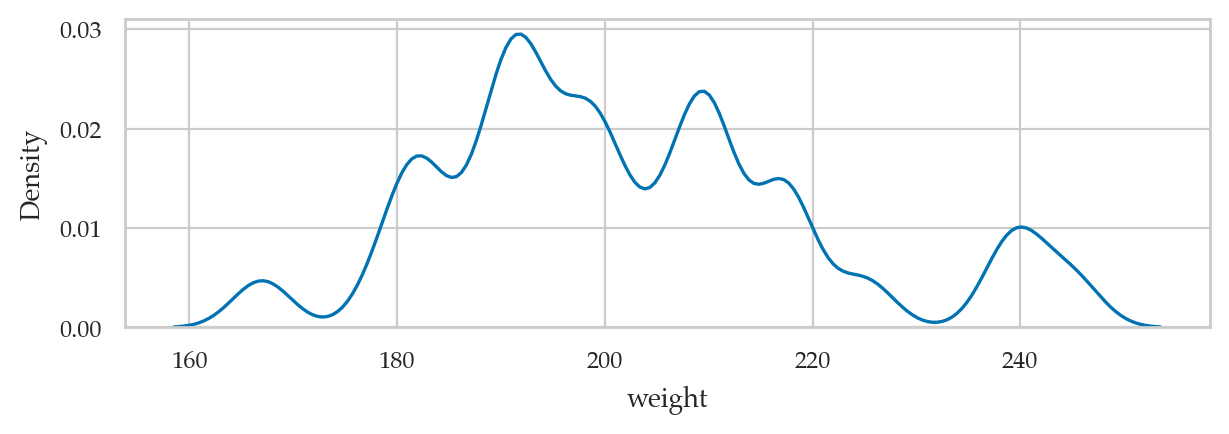
Next let’s calculate the mean of the sample:
mean(asample)202.6Let’s also calculate the variance and the standard deviation of the sample of the apple weights:
var(asample)345.9724137931035std(asample)18.60033370112223# ALT. call `.describe()` to get five-point summary
asample.describe()count 30.000000
mean 202.600000
std 18.600334
min 167.000000
25% 191.250000
50% 199.000000
75% 210.750000
max 245.000000
Name: weight, dtype: float64Example 2: kombucha volume mean and variance
kombucha = pd.read_csv("datasets/kombucha.csv")
# kombucha
batch01 = kombucha[kombucha["batch"]==1]
ksample01 = batch01["volume"]
len(ksample01)40ksample01.head(3)0 1016.24
1 993.88
2 994.72
Name: volume, dtype: float64sns.kdeplot(ksample01, bw_adjust=0.3);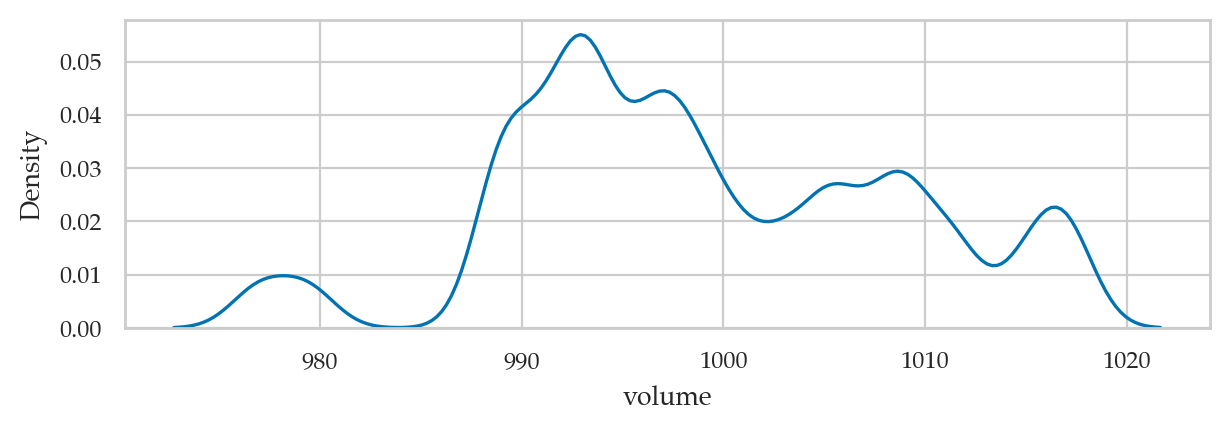
mean(ksample01)999.10375var(ksample01)95.4365419871796std(ksample01)9.769162808919686Sampling distributions
Let’s look at the same estimators that we described in the previous section, but this time applied to random samples of size :
Sample mean:
Sample variance:
Sample standard deviation:
Note these formulas is identical to the formulas we saw earlier. The only difference is that we’re calculating the functions , , and based on a random sample , instead of particular sample .
Example 4
from ministats import gen_samples
from ministats import plot_samples
from ministats import gen_sampling_dist
from ministats import plot_sampling_dist
Let’s generate samples , and compute the mean, the variance, and the standard deviation in each sample.
from scipy.stats import norm
rvZ = norm(0, 1)

zsamples_df = gen_samples(rvZ, n=20, N=10)
with plt.rc_context({"figure.figsize":(7, 2)}):
    ax = plot_samples(zsamples_df, xlims=[-2.5,2.5], showstd=True)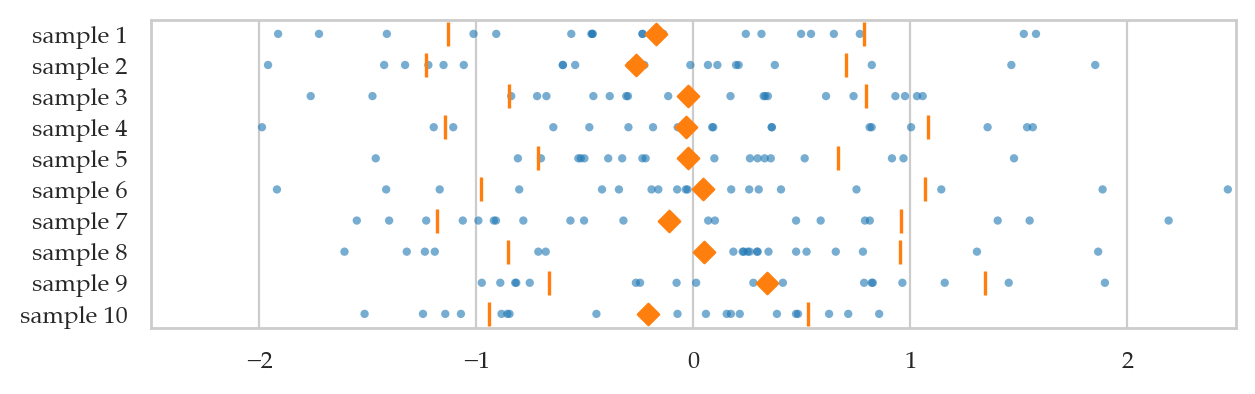
Now imagine repeating this process for samples .
We can obtain an approximation of the sampling distribution of the mean, by plotting a histogram of the means we computed from the 1000 random samples:
where denotes the sample mean computed from the data in the th sample: .
fig, ax = plt.subplots()

np.random.seed(43)
zbars = gen_sampling_dist(rvZ, estfunc=mean, n=20, N=1000)
plot_sampling_dist(zbars, ax=ax, binwidth=0.06, scatter="mean", filename=None)
ax.set_xlim([-2.5,2.5])
ax.set_xlabel(r"$\overline{\mathbf{z}}$")
ax.set_ylabel(r"$f_{\overline{\mathbf{Z}}}$");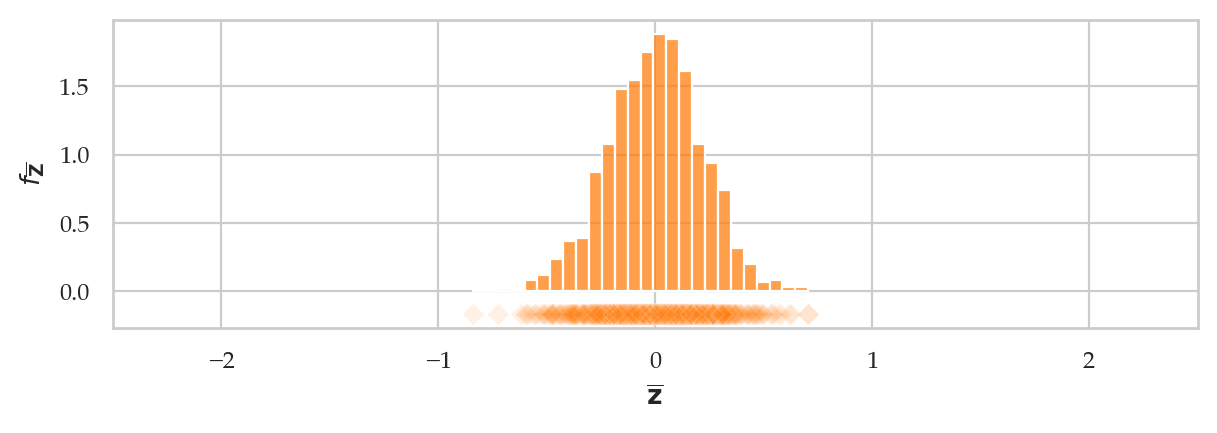
We can obtain an approximation of the sampling distribution of the sample standard deviation, by plotting a histogram of the standard deviations we computed from the 1000 random samples:
where denotes the standard deviation computed from the th sample: .
fig, ax = plt.subplots()

np.random.seed(44)
zstds = gen_sampling_dist(rvZ, estfunc=std, n=20, N=1000)
plot_sampling_dist(zstds, ax=ax, binwidth=0.03, scatter="std", filename=None)
ax.set_xlabel(r"$s_{\mathbf{z}}$")
ax.set_ylabel(r"$f_{S_{\mathbf{Z}}}$");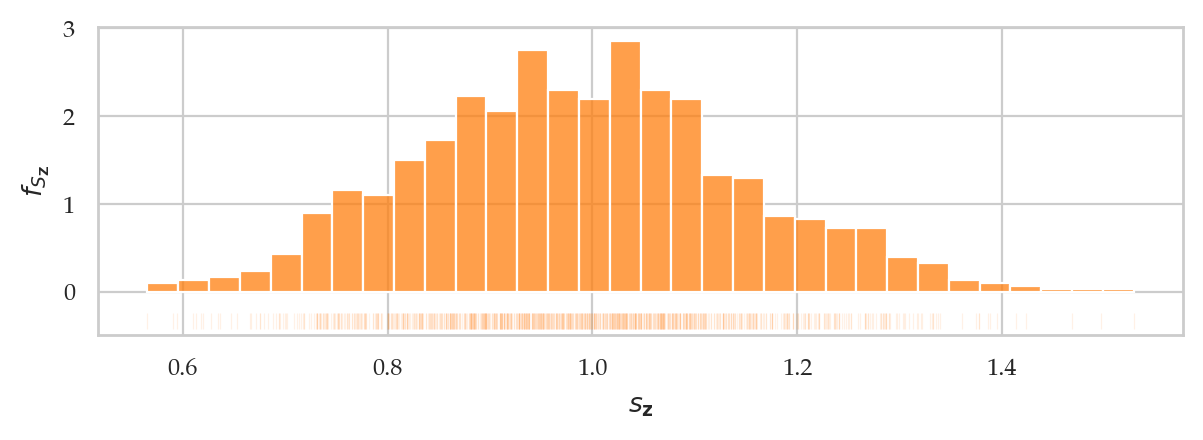
Illustration
The sampling distribution of the estimator is defined as the random variable , which is the output of the estimator when the input is a random sample .
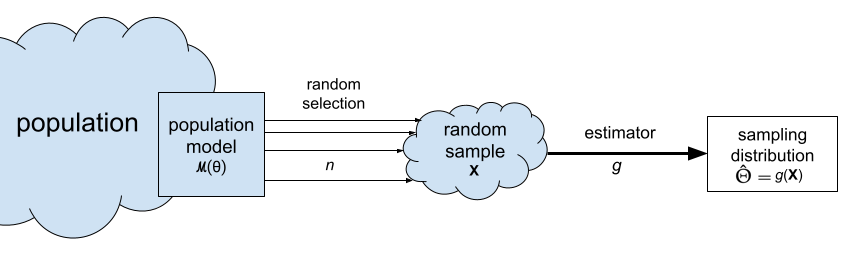
Estimator properties
The bias of the estimator is defined as: . The bias measures how much the estimates differ from the true population parameter, on average.
The variance of an estimator is , and it measures the variability of the estimates around the average.
The standard error of the estimator is the square root of its variance and denoted .
Illustration
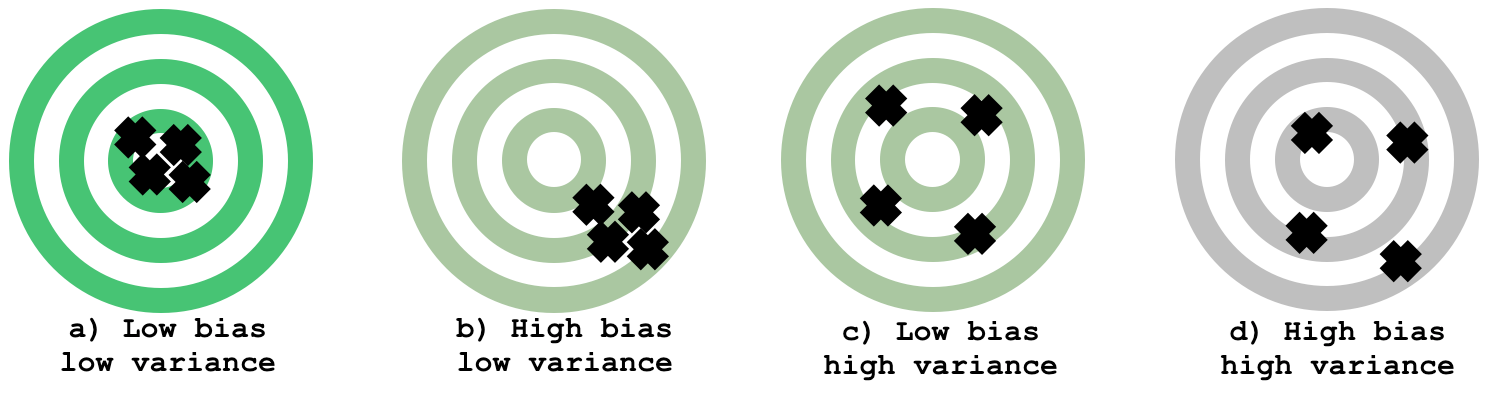
a) all the arrow hits are on target (low bias) and close together (low variance). This is the best-case scenario.
b) the arrow hits are still close to each other, which means the estimator has low variance, but the hits are consistently “off” the centre (below and to the right), which illustrates a biased estimator.
c) is an illustration of a high-variance estimator with no bias. The arrow hits are spread out, but mostly centred on the target.
d) shows the worst case scenario: and estimator that has high bias (consistently off) and high variance (spread out).
Computational approach to sampling distributions
def gen_sampling_dist(rv, estfunc, n, N=10000):
    estimates = []
    for i in range(0, N):
        sample = rv.rvs(n)
        estimate = estfunc(sample)
        estimates.append(estimate)
    return estimates

# ALT.
# from ministats import gen_sampling_dist
Example 5: sampling distributions of the kombucha volume
The probability distribution of the kombucha volume is know to be . This is an usual case where we know the population parameters, but we’ll investigate because it allows us to learn more about sampling distributions.
from scipy.stats import norm
muK = 1000
sigmaK = 10
rvK = norm(muK, sigmaK)

plot_pdf(rvK, xlims=[960,1040], rv_name="K");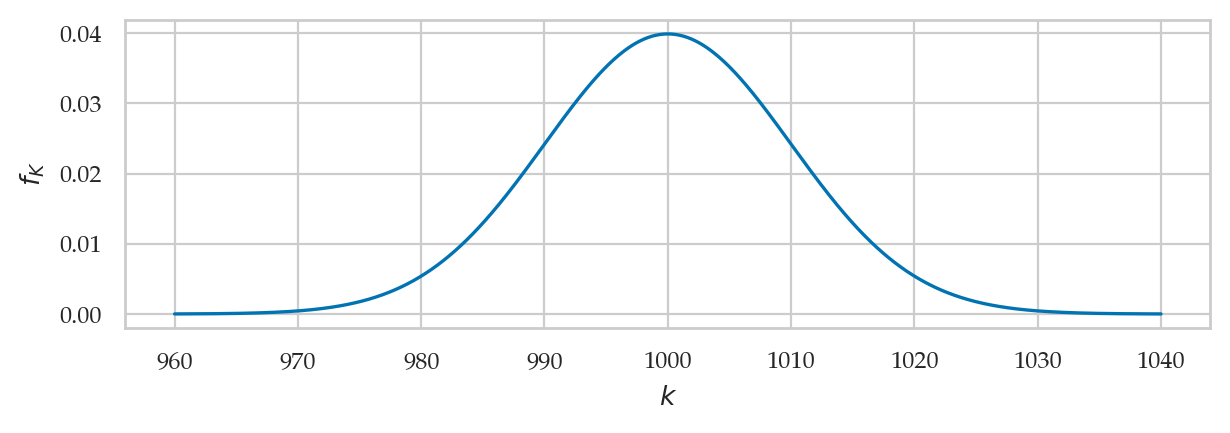
Sampling distribution of the mean
np.random.seed(43)
kbars20 = gen_sampling_dist(rvK, estfunc=mean, n=20)
ax = sns.histplot(kbars20, stat="density", bins=60, color="C1")
ax.set_xlim([990,1010])
ax.set_ylabel(r"$f_{\overline{\mathbf{K}}}$")
ax.set_xlabel(r"$\overline{\mathbf{k}}$");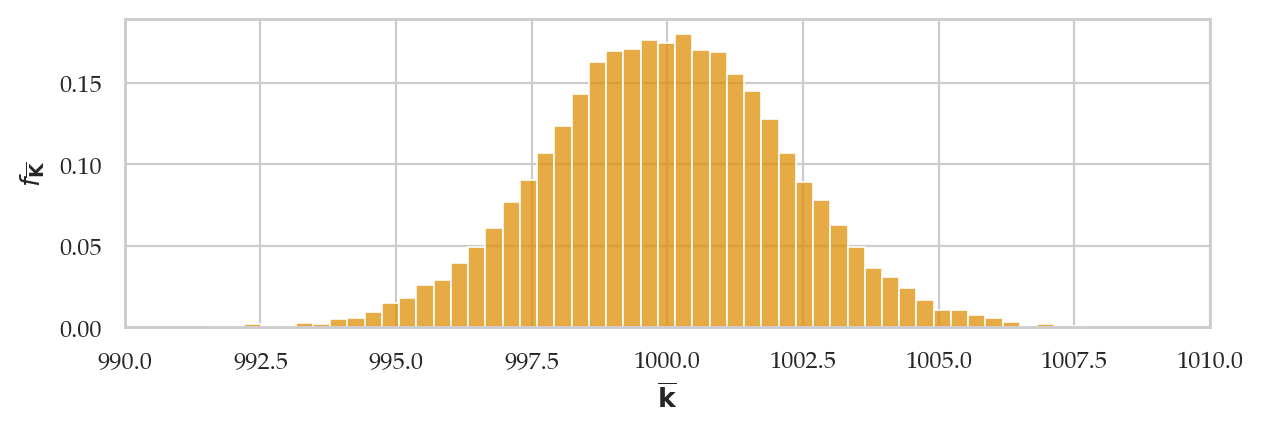
We can verify the mean estimator is unbiased, since the mean of the sampling distribution is very close to the population mean:
# observed,         population mean
np.mean(kbars20),   muK
(999.9759718368696, 1000)Let’s calculate the standard error of the estimator
# observed standard deviation
np.std(kbars20)2.2080598530804383# CLT prediction
sigmaK / np.sqrt(20)2.23606797749979Sampling distribution of the variance
np.random.seed(44)
kvars20 = gen_sampling_dist(rvK, estfunc=var, n=20)
ax = sns.histplot(kvars20, stat="density", bins=100, color="C1")
ax.set_ylabel(r"$f_{S_{\mathbf{K}}}$")
ax.set_xlabel(r"$s^2_{\mathbf{k}}$");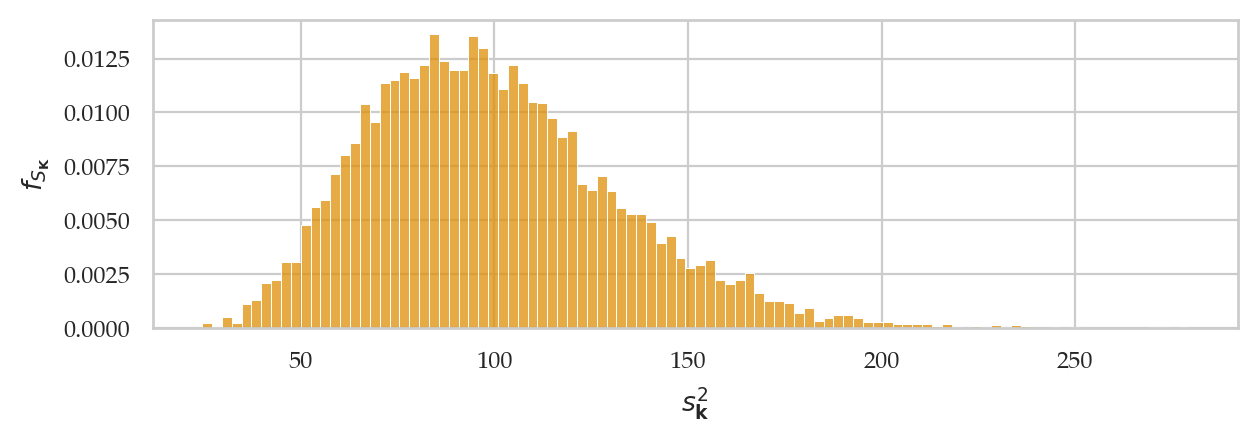
The sample variance estimator is unbiased
# observed          # population var
np.mean(kvars20),   sigmaK**2
(99.39922540353122, 100)Approximating sampling distribution
Let’s look at a particular sample ksample02 that comes from Batch 02 of the kombucha bottling plant.
kombucha = pd.read_csv("datasets/kombucha.csv")
batch02 = kombucha[kombucha["batch"]==2]
ksample02 = batch02["volume"]
# ksample02len(ksample02)20ksample02.valuesarray([ 995.83, 999.44, 978.64, 1016.4 , 982.07, 991.58, 1005.03,
987.55, 989.42, 990.91, 1005.51, 1022.92, 1000.42, 988.82,
1005.39, 994.04, 999.81, 1011.75, 992.52, 1000.09])ax = plot_pdf(rvK, xlims=[960,1040], rv_name="K")
sns.histplot(ksample02, ax=ax, stat="density", bins=35);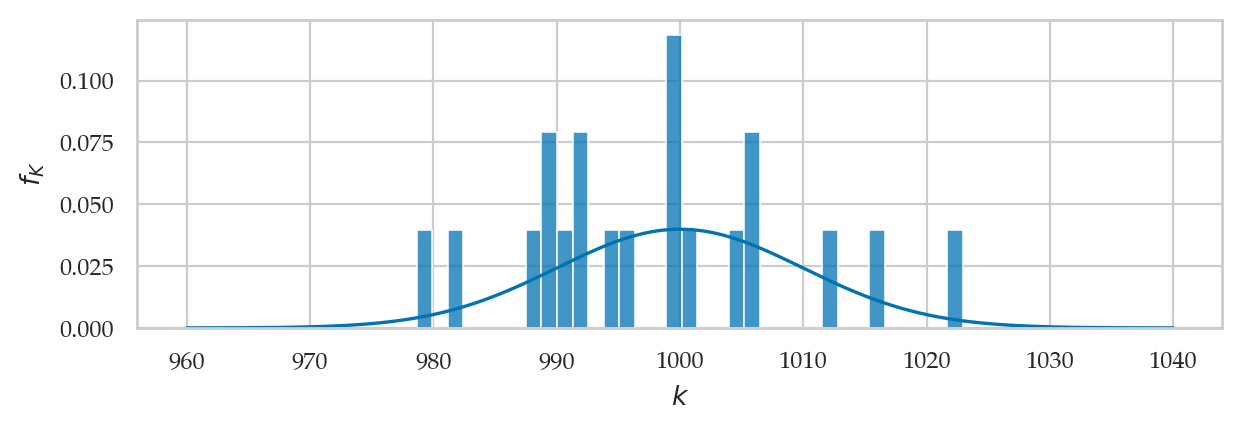
mean(ksample02)997.9069999999999std(ksample02)11.149780314097287Bootstrap estimation
Minimal example
# one sample of observations
xsample = [1, 2, 3, 4]
# one bootstrap observation
np.random.seed(42)
bx = np.random.choice(xsample)
bx3# bootstrap sample
np.random.seed(42) # comment this line to generate new bootstrap samples
bsample = np.random.choice(xsample, size=len(xsample))
bsamplearray([3, 4, 1, 3])Interactive bootstrap samples example
Re-run the following code cell many times to see different bootstrap samples from ksample02.
# generate new bootstrap sample
bksample02 = np.random.choice(ksample02, size=len(ksample02))

# plot a histogram of bksample02
with plt.rc_context({"figure.figsize":(4,2)}):
    ax = sns.histplot(bksample02, stat="density", bins=35, color=purple)
    ax.set_xlim([970,1030])
    ax.set_ylabel(r"$f_{\mathbf{k}^*}$")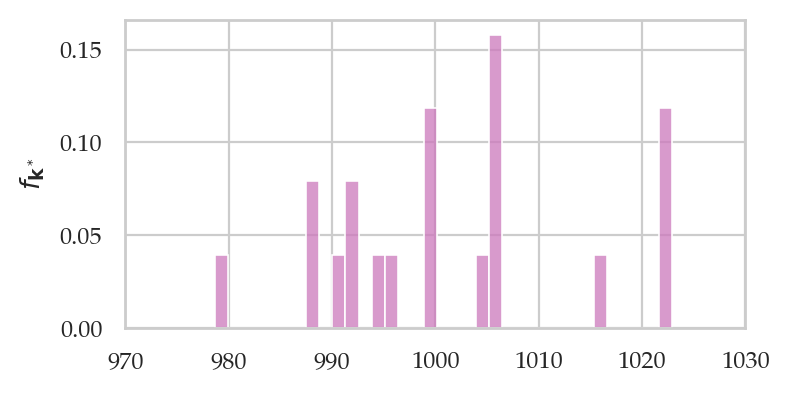
General-purpose bootstrap estimation function
def gen_boot_dist(sample, estfunc, B=5000):
    """
    Generate estimates from the sampling distribiton of the estimator `estfunc`
    based on `B` bootstrap samples (sampling with replacement) from `sample`.
    """
    n = len(sample)
    bestimates = []
    for i in range(0, B):
        bsample = np.random.choice(sample, n, replace=True)
        bestimate = estfunc(bsample)
        bestimates.append(bestimate)
    return bestimates

# ALT.
# from ministats import gen_boot_dist
Example 6
Let’s use the function gen_boot_dist to obtain the sampling distribution of the mean from the sample ksample02.
np.random.seed(42)
kbars_boot = gen_boot_dist(ksample02, estfunc=mean)
ax = sns.histplot(kbars_boot, stat="density")
ax.set_ylabel(r"$f_{\overline{\mathbf{K}}^*}$")
ax.set_xlabel(r"$\overline{\mathbf{k}}^*$");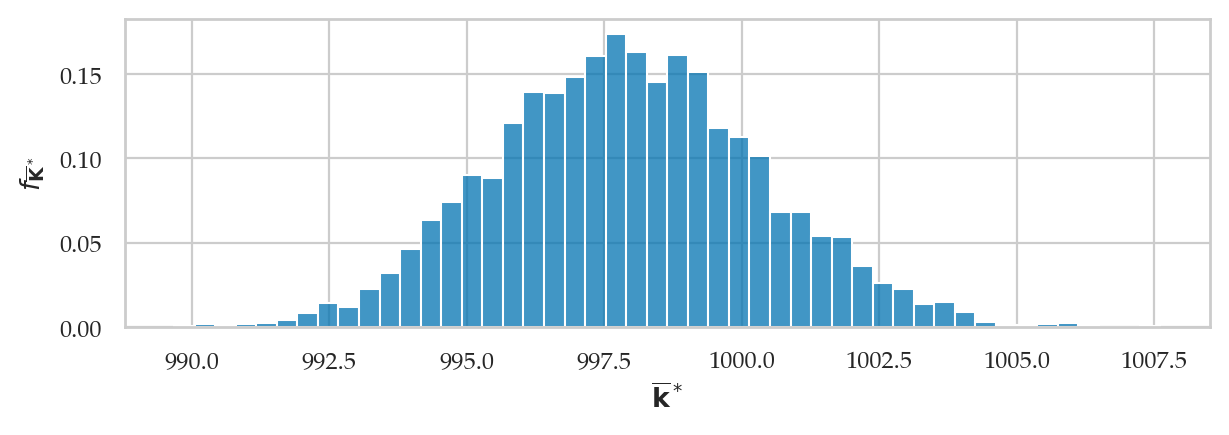
We can obtain an bootstrap estimate of standard error of the mean by computing the standard deviation of the bootstrap distribution.
# bootstrap est.    # simulation
np.std(kbars_boot), np.std(kbars20)
(2.415083743362255, 2.2080598530804383)The expected value of the bootstrap distribution matches the sample mean.
# E[bootstrap means]  # sample mean    # population
np.mean(kbars_boot),  mean(ksample02), muK
(997.9296855999999, 997.9069999999999, 1000)Analytical approximation formulas
We can use probability theory formulas to come up with approximations for certain sampling distributions.
Indeed many of the probability distributions we learned about in the probability chapter are used to describe sampling distributions of various estimators:
The normal distribution
Student’s -distribution: sample mean from a normally distributed population with unknown variance
Chi-square distribution: variance of samples from a normal population
Fisher–Snedecor -distribution: ratios of variances (only discussed later in the book)
The best example of the analytical approximation formula is the central limit theorem.
Central limit theorem
# standard error of the mean
seKbar = sigmaK / np.sqrt(20)

# CLT prediction   # simulation
seKbar,            np.std(kbars20)
(2.23606797749979, 2.2080598530804383)# CLT approx
from scipy.stats import norm
rvKbarCLT = norm(loc=muK, scale=seKbar)# kbars20 (repeat)
np.random.seed(43)
kbars20 = gen_sampling_dist(rvK, estfunc=mean, n=20)
# plot hist and pdf superimposed
ax = sns.histplot(kbars20, stat="density", bins=60, color=orange)
plot_pdf(rvKbarCLT, ax=ax, xlims=[990,1010], color="m")
ax.set_ylabel(r"$f_{\overline{\mathbf{K}}}$")
ax.set_xlabel(r"$\overline{\mathbf{k}}$");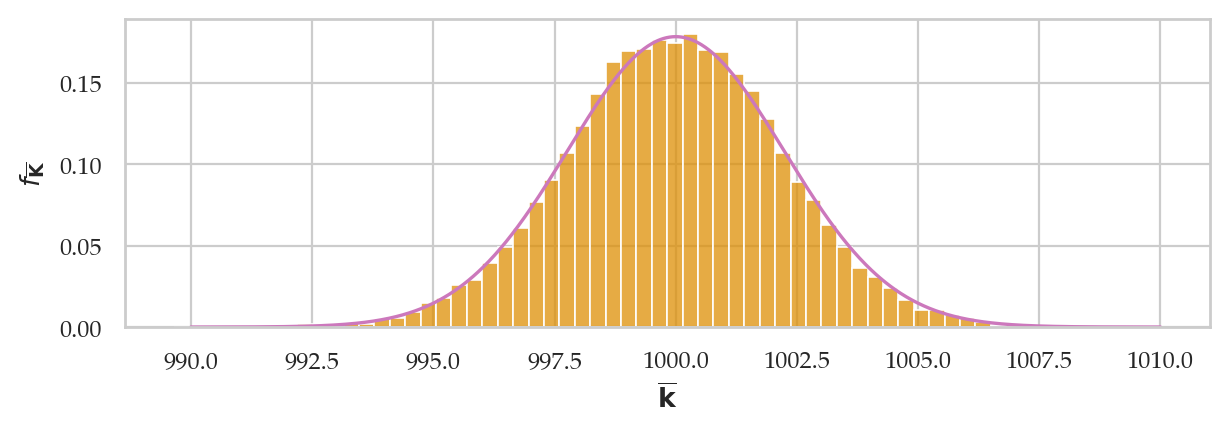
Sampling distribution of the mean
The central limit theorem tells us everything we need to know about the sampling distribution of the sample mean estimator , which corresponds to the random variable .
The central limit theorem states that the sampling distribution of the mean converges to a normal distribution as goes to infinity:
Note the central limit theorem gives a sampling distribution of the sample mean computed from samples taken from any population .
True sampling distribution
We start by running a simulation to obtain the true sampling distribution of the sample mean for samples of size from the population .
np.random.seed(43)
kbars7 = gen_sampling_dist(rvK, estfunc=mean, n=7)
ax = sns.histplot(kbars7, stat="density", bins=100, color=orange)
ax.set_ylabel(r"$f_{\overline{\mathbf{K}}}$")
ax.set_xlabel(r"$\overline{\mathbf{k}}$");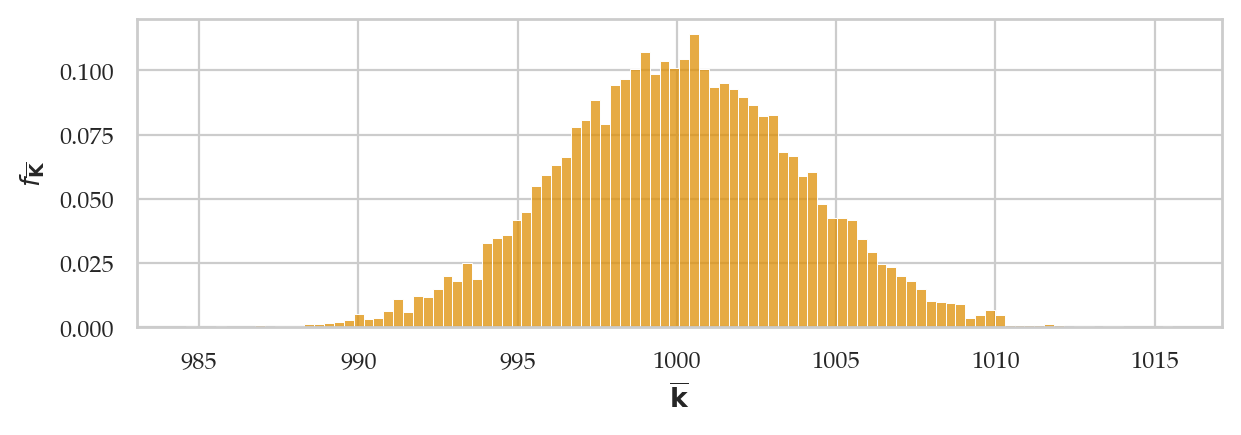
This is the true sampling distribution of the sample mean generated using simulation from samples of size . We can use this graph as the “ground truth” for the approximations techniques we’ll learn next.
np.std(kbars7)3.8051688517483897Prediction of the central limit theorem
Compute the standard error using according to the central limit theorem :
seKbar = rvK.std() / np.sqrt(7)
seKbar3.779644730092272Sampling distribution of the mean according to CLT
rvKbarCLT = norm(loc=muK, scale=seKbar)Let’s now superimpose a lineplot of the analytical approximation formula we obtain from the central limit theorem.
# plot hist and pdf superimposed
ax = sns.histplot(kbars7, stat="density", bins=100, color=orange)
plot_pdf(rvKbarCLT, ax=ax, xlims=[985,1015], color="m")
ax.set_ylabel(r"$f_{\overline{\mathbf{K}}}$")
ax.set_xlabel(r"$\overline{\mathbf{k}}$");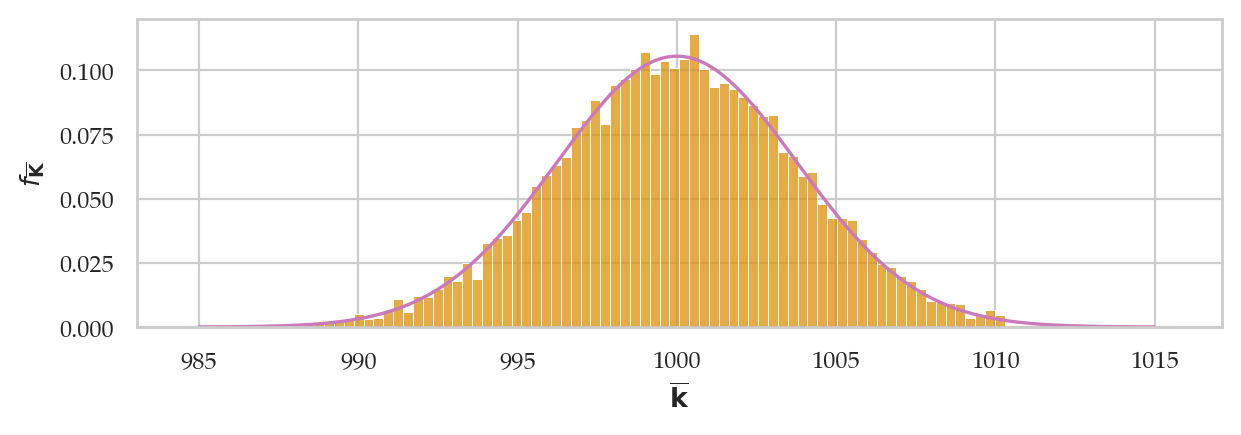
The plug-in principle
Next we consider real-world statistical analysis scenario when we don’t know the population variance, but instead have to estimate it from a particular sample of observations. Specifically, we’ll load the sample form Batch 03.
kombucha = pd.read_csv("datasets/kombucha.csv")
batch03 = kombucha[kombucha["batch"]==3]
ksample03 = batch03["volume"]
len(ksample03)7ksample03.head(3)60 1005.19
61 987.31
62 1002.40
Name: volume, dtype: float64The estimated standard deviation computed from ksample03 is:
std(ksample03)8.519494731273129This estimate is pretty close to the true population standard deviation
sigmaK .
Let’s now compute the estimated standard error using the plug-in formula:
,
where is the estimated standard deviation computed from ksample03.
sehat03 = std(ksample03) / np.sqrt(7)
sehat033.220066336410536This is pretty close to the standard error
we would obtain if we knew the population standard deviation:
sigmaK/np.sqrt(7) = 3.78.
Normal approximation to the sampling distribution
We now obtain the best normal approximation based on the estimated standard error sehat03
that we computed from the data in ksample03.
rvNKbar = norm(loc=muK, scale=sehat03)

ax = sns.histplot(kbars7, stat="density", bins=100, color=orange, label="simulation")
plot_pdf(rvNKbar, ax=ax, xlims=[985,1015], color="red", label="normal approx.")
ax.set_ylabel(r"$f_{\overline{\mathbf{K}}}$")
ax.set_xlabel(r"$\overline{\mathbf{k}}$");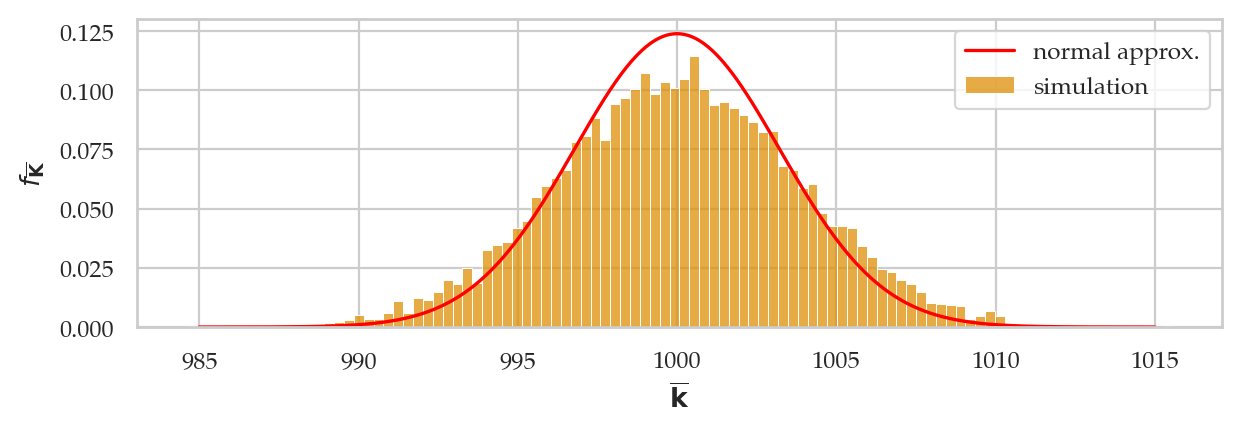
A better approximation
Student’s t-distribution (used whenever working with normally needed in context where using as plug-in estimate for σ).
Obtain Student’s -distribution based on the estimated standard error sehat03
that we computed from the data in ksample03.
from scipy.stats import t as tdist

df03 = 7 - 1  # degrees of freedom
rvTKbar = tdist(df=df03, loc=muK, scale=sehat03)

ax = sns.histplot(kbars7, stat="density", bins=100, color=orange, label="simulation")
plot_pdf(rvTKbar, ax=ax, xlims=[985,1015], color="m", label="Student's t approx.")
ax.set_ylabel(r"$f_{\overline{\mathbf{K}}}$")
ax.set_xlabel(r"$\overline{\mathbf{k}}$");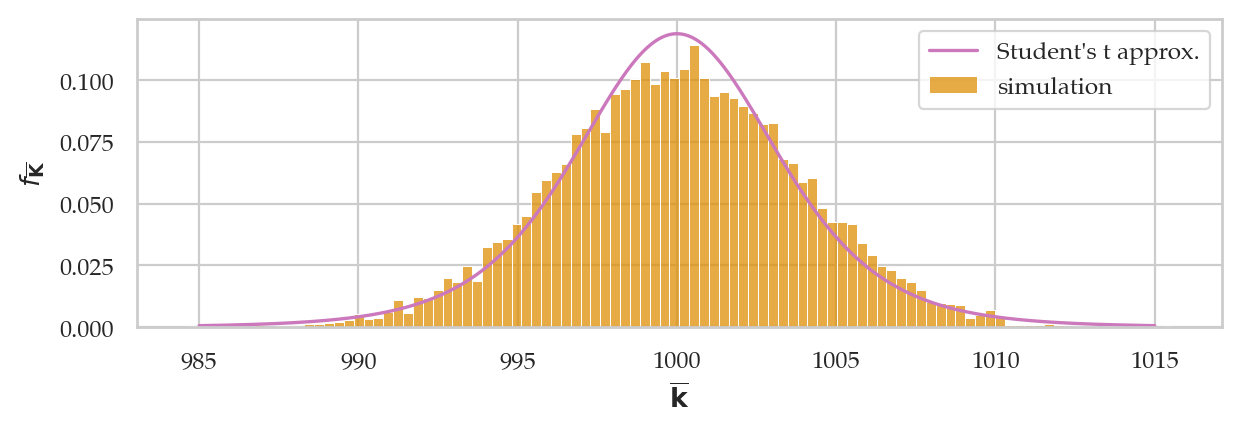
# Student's t       # simulation
rvTKbar.std(),      np.std(kbars7)
(3.943759731059507, 3.8051688517483897)Bootstrapped sampling distribution of the sample mean
# ground truth (in orange)
ax = sns.histplot(kbars7, stat="density", bins=100,
                  color=orange, alpha=0.3, label="simulation")

# bootstrap estimate (in blue)
np.random.seed(48)
kbars_boot03 = gen_boot_dist(ksample03, estfunc=mean)
sns.histplot(kbars_boot03, ax=ax, stat="density", bins=30,
             alpha=0.4, label="bootstrap estimates")
ax.set_ylabel(r"$f_{\overline{\mathbf{K}}}$")
ax.set_xlabel(r"$\overline{\mathbf{k}}$")
plt.legend();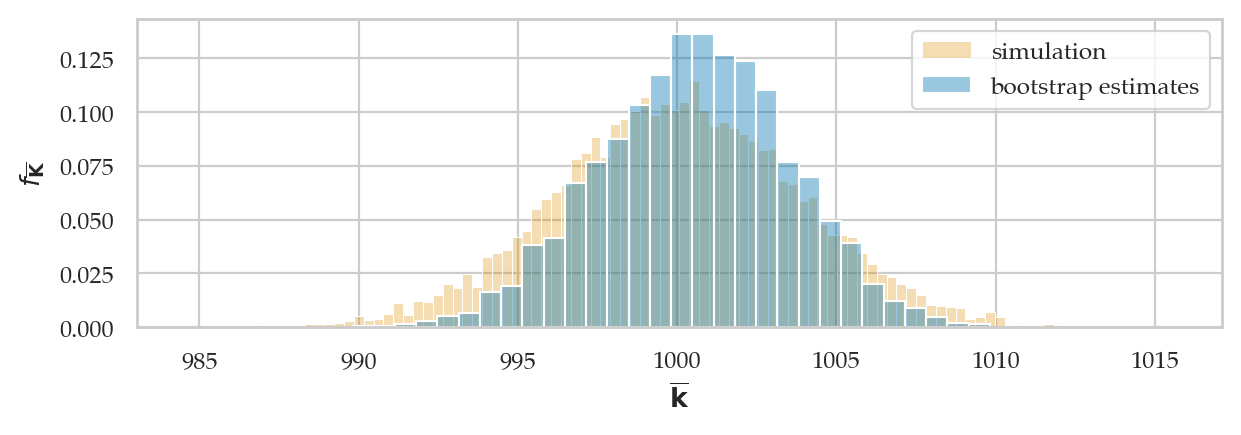
The expected value of the sampling distribution we obtained using bootstrap estimation is
# E[bootstrap dist.]   # sample mean     # population mean
np.mean(kbars_boot03), mean(ksample03),  muK
(1000.5607797142856, 1000.5371428571428, 1000)The standard error of the sampling distribution
# bootstrap est.      # simulation
np.std(kbars_boot03), np.std(kbars7)
(2.9673068567038365, 3.8051688517483897)# sample std # population std
std(ksample03), sigmaK(8.519494731273129, 10)Sampling distribution of the variance
When the population is normally distributed , the sampling distribution of the sample variance is described by a scaled version of the chi-square distribution:
where is the sample size and is the chi-square distribution with degrees of freedom.
Sampling distribution of the variance
Let’s start by plotting a histogram of the sampling distribution of the variance
computed from samples of size from the random variable rvK = .
np.random.seed(44)
kvars20 = gen_sampling_dist(rvK, estfunc=var, n=20)
ax = sns.histplot(kvars20, stat="density", bins=100, color=orange)
ax.set_ylabel(r"$f_{S^2_{\mathbf{K}}}$")
ax.set_xlabel(r"$s^2_{\mathbf{k}}$");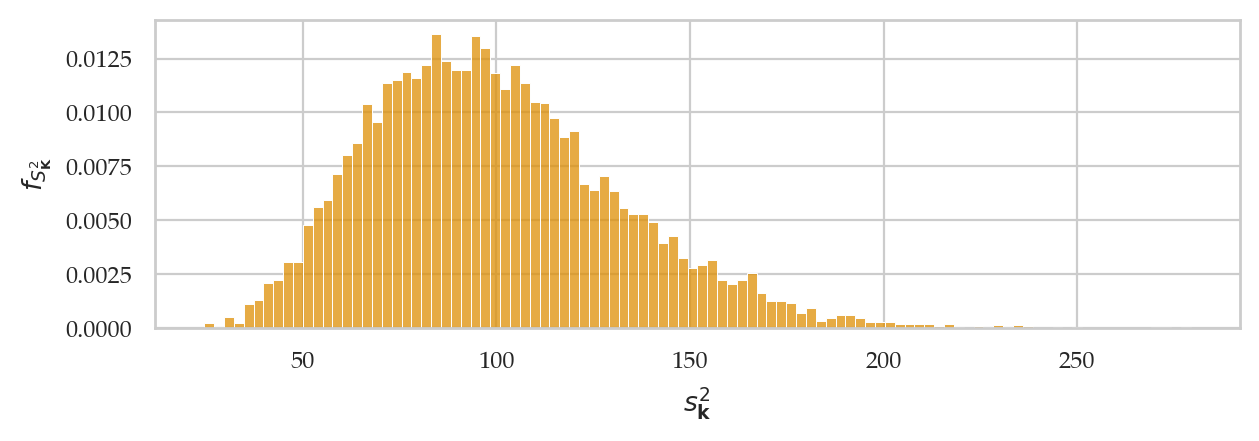
Let’s now superimpose the chi-square distribution with degrees of freedom, with scale parameter set to .
from scipy.stats import chi2

scale = sigmaK**2 / (20-1)
rvS2 = chi2(df=20-1, scale=scale)

ax = sns.histplot(kvars20, stat="density", bins=100, color=orange)
plot_pdf(rvS2, ax=ax, color="m")
ax.set_ylabel(r"$f_{S^2_{\mathbf{K}}}$")
ax.set_xlabel(r"$s^2_{\mathbf{k}}$");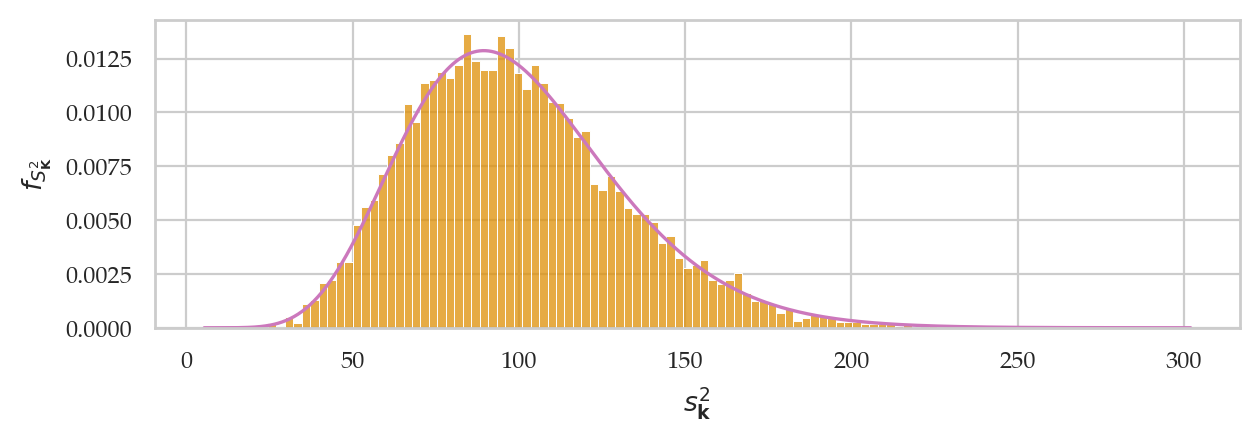
Bootstrapped sampling distribution of the sample variance
Let’s look again at the sample ksample02 that comes from Batch 02 of the kombucha bottling plant.
kombucha = pd.read_csv("datasets/kombucha.csv")
batch02 = kombucha[kombucha["batch"]==2]
ksample02 = batch02["volume"]
len(ksample02)20The sample variance we find from ksample02 is an over-estimate
of the population variance:
# sample var         # population var
var(ksample02),      sigmaK**2
(124.31760105263139, 100)So we should expect the bootstrap estimate we obtain
by resampling from ksample02 will also be an overestimate of the population.
# ground truth (in orange)
ax = sns.histplot(kvars20, stat="density", bins=100,
                  color=orange, alpha=0.3, label="simulation")

np.random.seed(49)
kvars_boot02 = gen_boot_dist(ksample02, estfunc=var)

# bootstrap estimate (in blue)
ax = sns.histplot(kvars_boot02, ax=ax, stat="density", bins=30,
                  alpha=0.7, label="bootstrap estimate")
ax.set_ylabel(r"$f_{S^2_{\mathbf{K}}}$")
ax.set_xlabel(r"$s^2_{\mathbf{k}}$")
plt.legend();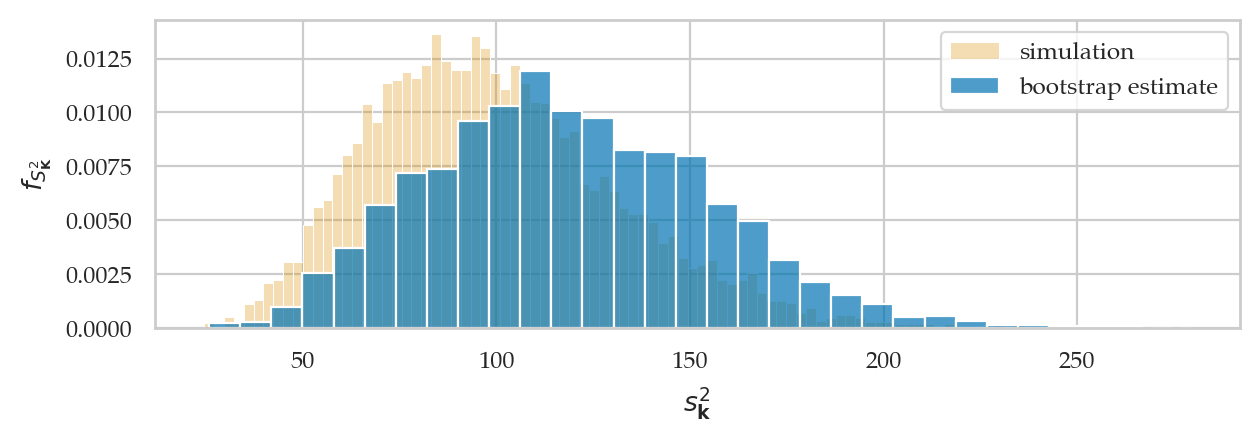
The expected value the sampling distribution we obtained using bootstrap estimation is:
# E[bootstrap vars]     # population variance
np.mean(kvars_boot02),  sigmaK**2
(118.6780201503156, 100)The expected value bootstrap variances overestimates the true population variance.
We can also compute standard error of the sampling distribution of the variance, denoted , and compare it to the true standard error computed through simulation:
# bootstrap est.        # simulated
np.std(kvars_boot02),   np.std(kvars20)
(35.96396081594617, 32.27334227853393)Alternative calculation methods
Using statsmodels for bootstrap estimation
Bootstrap mean
from scipy.stats import bootstrap

np.random.seed(42)
res = bootstrap([ksample02], statistic=mean,
                n_resamples=5000, vectorized=False)
sns.histplot(res.bootstrap_distribution)
len(res.bootstrap_distribution)
5000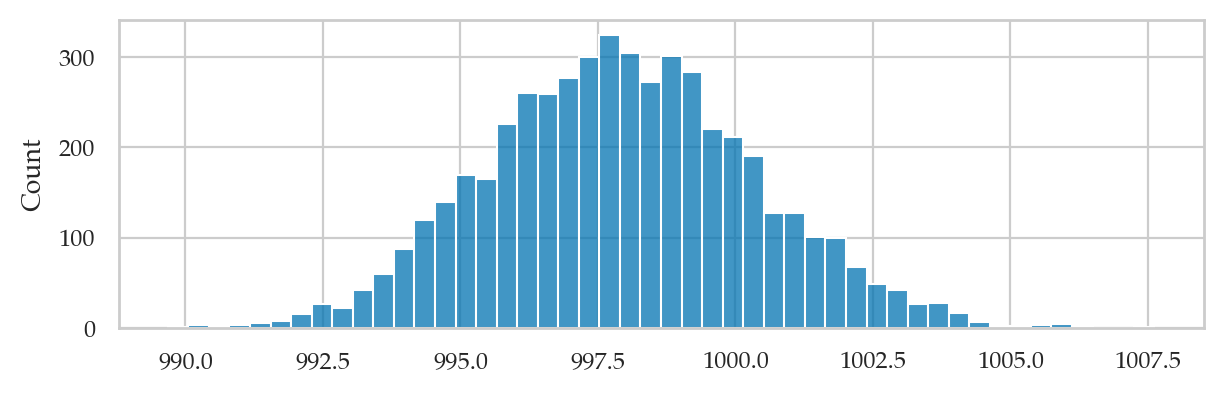
We can obtain bootstrap distribution of the variance
by simply changing the argument statistic=var.
See Exercise E3.16.
Explanations
Biased and unbiased estimators for the population variance
The sample variance estimator is an unbiased estimator of the population variance.
Let’s see what happens if we the estimator , which has denominator instead of .
First, let’s define the Python function altvar that performs this calculation:
def altvar(sample):
    xbar = mean(sample)
    sumsqdevs = sum([(xi-xbar)**2 for xi in sample])
    return sumsqdevs / len(sample)
from scipy.stats import norm
muK = 1000
sigmaK = 10
rvK = norm(muK, sigmaK)
np.random.seed(16)
altvars = gen_sampling_dist(rvK, estfunc=altvar, n=20)
ax = sns.histplot(altvars, stat="density", color=orange)
ax.set_xlabel(r"$\tilde{s}^2_{\mathbf{k}}$");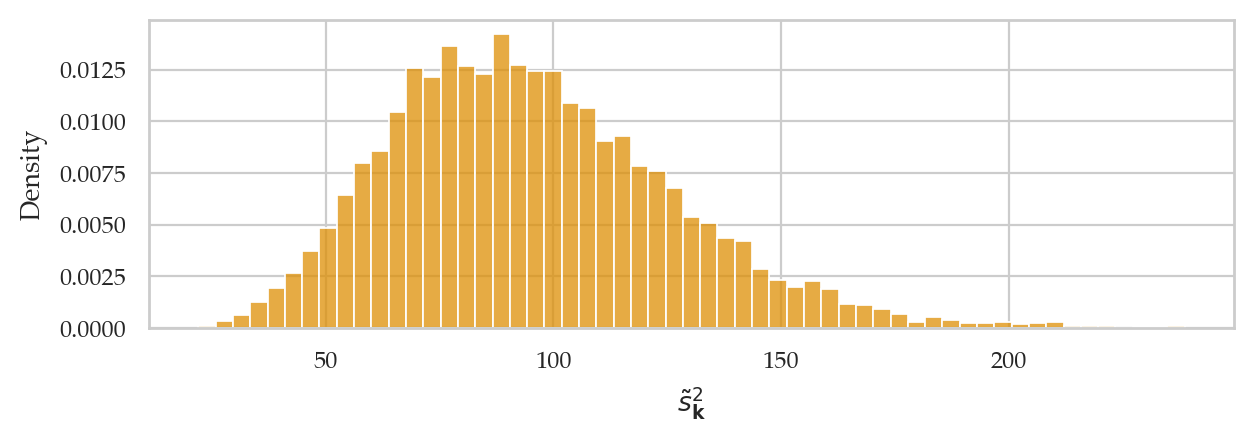
# E[simulated]     # population var
np.mean(altvars),  sigmaK**2
(95.28131350335453, 100)The expected value of the sampling distribution for this estimator does not equal the population variance, . The expected value will consistently underestimate .
We can correct the bias in this estimator by simply using the normalization factor in the formula instead of . This is how we end up with the unbiased estimator formula , for which .
np.random.seed(47)
kvars20 = gen_sampling_dist(rvK, estfunc=var, n=20)
# E[simulated]      # population var
np.mean(kvars20),   sigmaK**2
(99.91922831464032, 100)Pivotal quantities
Rephrase analytical approximations in terms of standard reference distributions, thanks to pivot transformation
We say is a pivotal quantity.
Recall the distribution for mean of kombucha volume modelled as rvTKbar,
and corresponds to the custom -distribution:
.
We can also get the same results using the standard -distribution.
from scipy.stats import t as tdist
rvT = tdist(df=7-1)
rvTKbar.ppf(0.95), rvT.ppf(0.95)*sehat03 + muK(1006.2571694068641, 1006.2571694068641)rvTKbar.cdf(1003), rvT.cdf( (1003-muK)/sehat03 )(0.8062670118096587, 0.8062670118096587)Recall the sampling distribution of the variance rvS2
with custom scale parameter.
Here are some examples of how we can do calculations using the un-scaled standard chi-square distribution.
from scipy.stats import chi2
rvX2 = chi2(df=20-1, scale=1)
scale = sigmaK**2 / (20-1)
rvS2.ppf(0.95), rvX2.ppf(0.95)*scale(158.6501431876113, 158.6501431876113)rvS2.cdf(150), rvX2.cdf(150/scale)(0.9257325359937036, 0.9257325359937036)Shifted sampling distributions
Two contexts for using sampling distribution:
Case 1: the population mean is known. We draw the sampling distribution centred on the population mean :
Case 2: the population mean is unknown. We can draw the sampling distribution centred on the sample mean :
Essentially, the sampling distribution formula we obtained describes the distribution of the deviations of the sample mean from the population mean: , so this is why we can use the same distribution in both contexts.
Estimation of the apples weights
apples = pd.read_csv("datasets/apples.csv")
asmpale = apples["weight"]
n = len(asample)
abar =  mean(asample)
asehat = std(asample) / np.sqrt(n)

# analytical approx.
from scipy.stats import t as tdist
rvTAbar = tdist(df=n-1, loc=abar, scale=asehat)
ax = plot_pdf(rvTAbar, xlims=[190,215], color=orange)
ax.set_xlabel(r"$\mu_A$")
ax.set_ylabel(r"$f_{\overline{\mathbf{A}}}$")

# sample mean
ax.axvline(abar, ymin=0, ymax=0.86, linestyle="--", color=orange)

# sample mean +/- se
ax.axvline(abar+asehat, ymin=0, ymax=0.86, linestyle="-", color=orange)
ax.axvline(abar-asehat, ymin=0, ymax=0.86, linestyle="-", color=orange);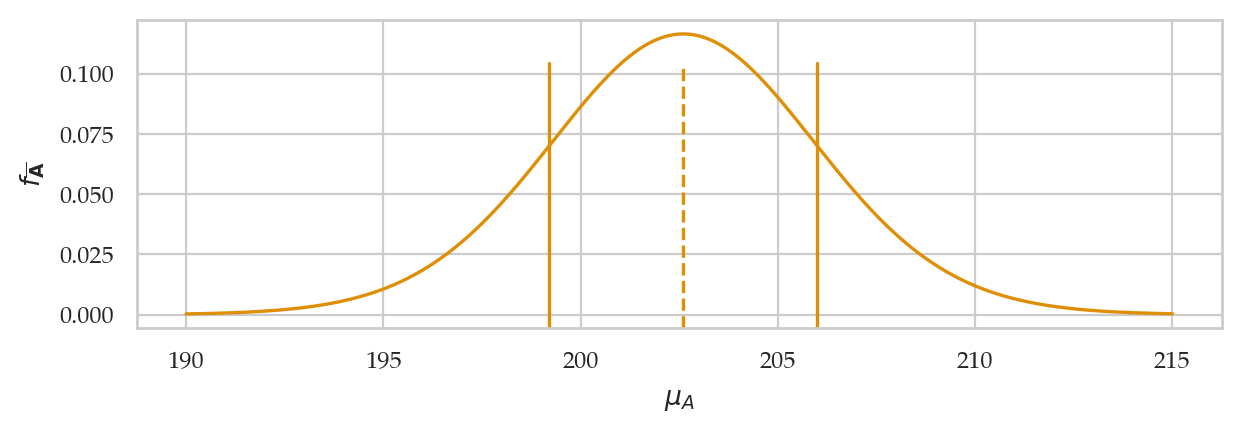
Kombucha volume probabilities
In Case P we know the population mean, and the random variable describes what kind of sample means we can expect to observe. We’ll use this type of reasoning for hypothesis testing.
kombucha = pd.read_csv("datasets/kombucha.csv")
ksample01 = kombucha[kombucha["batch"]==1]["volume"]
ksample06 = kombucha[kombucha["batch"]==6]["volume"]

kbar01 = mean(ksample01)
kbar06 = mean(ksample06)
n = len(ksample01)

# analytical approx.
from scipy.stats import t as tdist
rvTKbar = tdist(df=n-1, loc=muK, scale=sigmaK/np.sqrt(n))
ax = plot_pdf(rvTKbar, xlims=[993,1007], color=blue)
ax.set_ylabel(r"$f_{\overline{\mathbf{K}}}$")
ax.set_xlabel(r"$\overline{\mathbf{k}}$")

# sample mean ksample01
ax.axvline(kbar01, linestyle="--", color="blue")
ax.text(kbar01-0.1, 0.31, r"$\overline{\mathbf{k}}_{01}$", ha="right", color="blue")

# sample mean ksample06
ax.axvline(kbar06, linestyle="--", color="red")
ax.text(kbar06-0.1, 0.31, r"$\overline{\mathbf{k}}_{06}$", ha="right", color="red");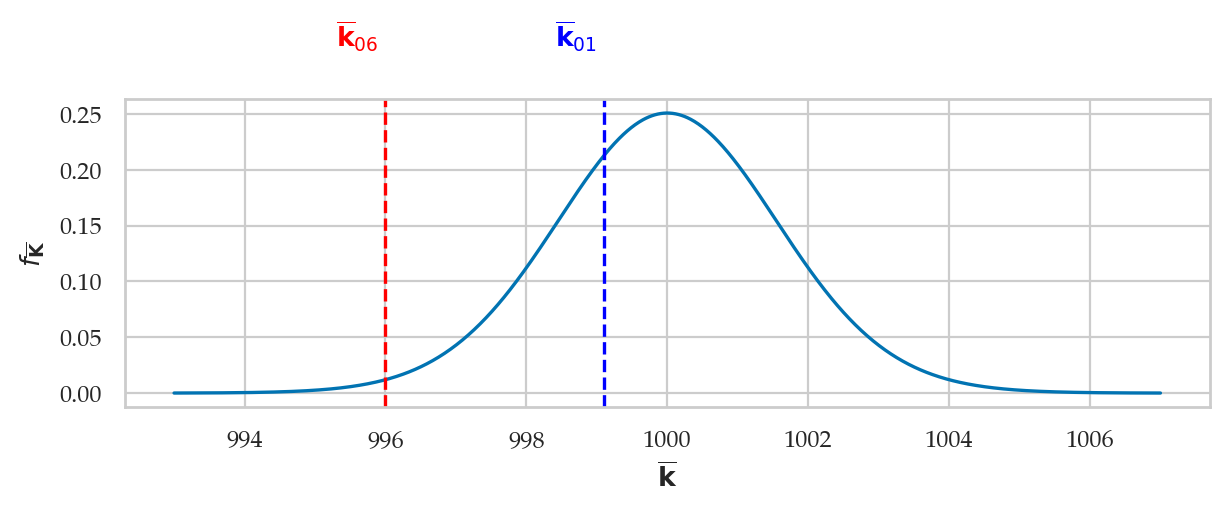
Discussion
Congratulations on surviving until the end this notebook! In the remainder of this chapter and the next, we’ll learn about various applications of the formulas we introduces in this section. Basically, it’s all downhill from here.
In the next notebook, we’ll learn how to use everything we learned about sampling distributions to calculate confidence intervals.