The goal of the one-sample -test to check if the mean of an unknown population ,
equals the mean of a theoretical distribution .
Note we assume that standard deviation of the unknown population is known
and equal to the standard deviation of the theoretical population .
We discussed this hypothesis test in notebooks
import matplotlib.pyplot as plt
import numpy as np
import seaborn as sns
%matplotlib inline
%config InlineBackend.figure_format = 'retina'Data
One sample of numerical observations .
Modeling assumptions
We model the unknown population as...
and the theoretical distribution is...
We assume the population is normally distributed , or the sample is large enough .
We also assume that the variance of the unknown population is known and equal to the variance of the theoretical population under
Hypotheses
and , where is the unknown population mean, is the theoretical mean we are comparing to.
Test statistic
Compute , where is the sample mean, is the theoretical population mean, is the known standard deviation.
Sampling distribution
Standard normal distribution .
P-value calculation
from ministats import ztest

%psource ztest
def ztest(sample, mu0, sigma0, alt="two-sided"):
"""
Z-test to detect mean deviation from known normal population.
"""
mean = np.mean(sample)
n = len(sample)
se = sigma0 / np.sqrt(n)
obsz = (mean - mu0) / se
rvZ = norm(0,1)
pval = tailprobs(rvZ, obsz, alt=alt)
return pval
To perform the one-sample -test on the sample xs,
we call ztest(xs, mu0=..., sigma0=...),
with the ...s replaced by the mean and standard deviation parameters of the distribution under .
Examples
For all the examples we present below, we assume the theoretical distribution we expect under the null hypothesis, is normally distributed with mean and standard deviation :
from scipy.stats import norm
muX0 = 100
sigmaX0 = 5
rvX0 = norm(muX0, sigmaX0)
Example A: population different from 
Suppose the unknown population is normally distributed with mean and standard deviation :
muXA = 104
sigmaXA = 3
rvXA = norm(muXA, sigmaXA)
Let’s generate a sample xAs of size from the random variable .
np.random.seed(42)

# generate a random sample of size n=20
n = 20
xAs = rvXA.rvs(n)
xAs
array([105.49014246, 103.5852071 , 105.94306561, 108.56908957,
103.29753988, 103.29758913, 108.73763845, 106.30230419,
102.59157684, 105.62768013, 102.60974692, 102.60281074,
104.72588681, 98.26015927, 98.8252465 , 102.31313741,
100.96150664, 104.942742 , 101.27592777, 99.7630889 ])import seaborn as sns
with plt.rc_context({"figure.figsize":(7,1)}):
sns.stripplot(x=xAs, jitter=0, alpha=0.5)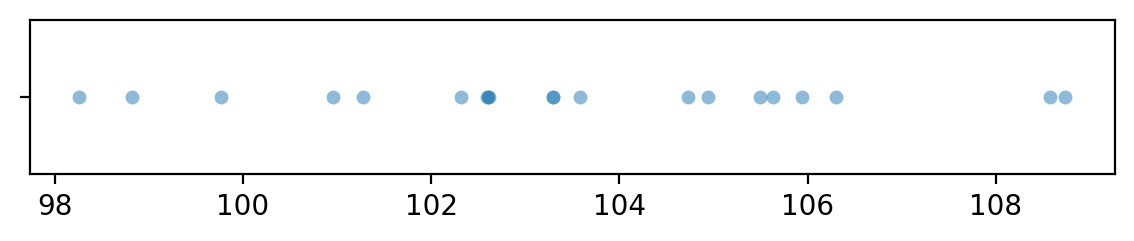
To obtain the -value, we first compute the observed -statistic, then calculate the tail probabilities in the two tails of the standard normal distribution .
obsmean = np.mean(xAs)
se = sigmaX0 / np.sqrt(n)
obsz = (obsmean - muX0) / se
rvZ = norm(0,1)
pvalue = rvZ.cdf(-obsz) + 1-rvZ.cdf(obsz)
obsz, pvalue
(3.1180664906014357, 0.0018204172963375287)The helper function ztest in the ministats module performs
exactly the same sequence of steps to compute the -value.
from ministats import ztest
ztest(xAs, mu0=muX0, sigma0=sigmaX0)0.0018204172963375855The -value we obtain is 0.0018 (0.18%),
which is below the cutoff value ,
so our conclusion is we reject the null hypothesis:
the mean of the sample xAs is not statistically significantly different from the theoretically expected mean .
Example B: sample from a population as expected under 
# unknown population X = X0
rvXB = norm(muX0, sigmaX0)
Let’s generate a sample xBs of size from the random variable ,
which has the same distribution as the theoretical distribution we expect under the null hypothesis.
# np.random.seed(32)  produces false positie
np.random.seed(31)

# generate a random sample of size n=20
n = 20
xBs = rvXB.rvs(n)
xBs
array([ 97.92621393, 98.33315666, 100.40545993, 96.04486524,
98.90700164, 96.18401578, 96.11439878, 109.24678261,
96.47199845, 99.56978983, 101.43966651, 99.34306739,
95.08627924, 95.40604357, 105.99717245, 98.29312879,
91.20696344, 100.25558735, 97.14035504, 96.49716979])import seaborn as sns
with plt.rc_context({"figure.figsize":(7,1)}):
sns.stripplot(x=xBs, jitter=0, alpha=0.5)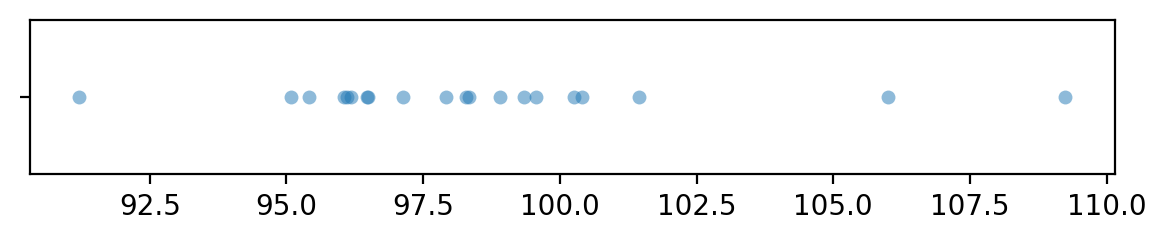
from ministats import ztest
ztest(xBs, mu0=muX0, sigma0=sigmaX0)0.17782115942197962The -value we obtain is 0.18, which is above the cutoff value
so our conclusion is that we’ve failed to reject the null hypothesis:
the mean of the sample xBs is not significantly different from the theoretically expected mean .
Effect size estimates
Related
Use the one-sample -test if you want to use the sample standard deviation
Identical calculations to the one-saple -test for proportions
Discussion
Links
CUT MATERIAL
# NOT GOOD: because we can't specify sigma0 manually;
#           the statsmodels function uses sample std instead of sigmaX0
# from statsmodels.stats import weightstats
# weightstats.ztest(x1, x2=None, value=0)