To perform two-sample equivalence test, we’ll use the same procedure as Welch’s two-sample -test, but this time prove that two unknown population and are not different.
import matplotlib.pyplot as plt
import numpy as np
import seaborn as sns
import pandas as pd
%matplotlib inline
%config InlineBackend.figure_format = 'retina'
(this cell contains the macro definitions like , , , ...)
Data
Two samples of numerical observations and from independent populations.
Modeling assumptions
We assume the unknown populations are normally distributed , or the sample is large enough .
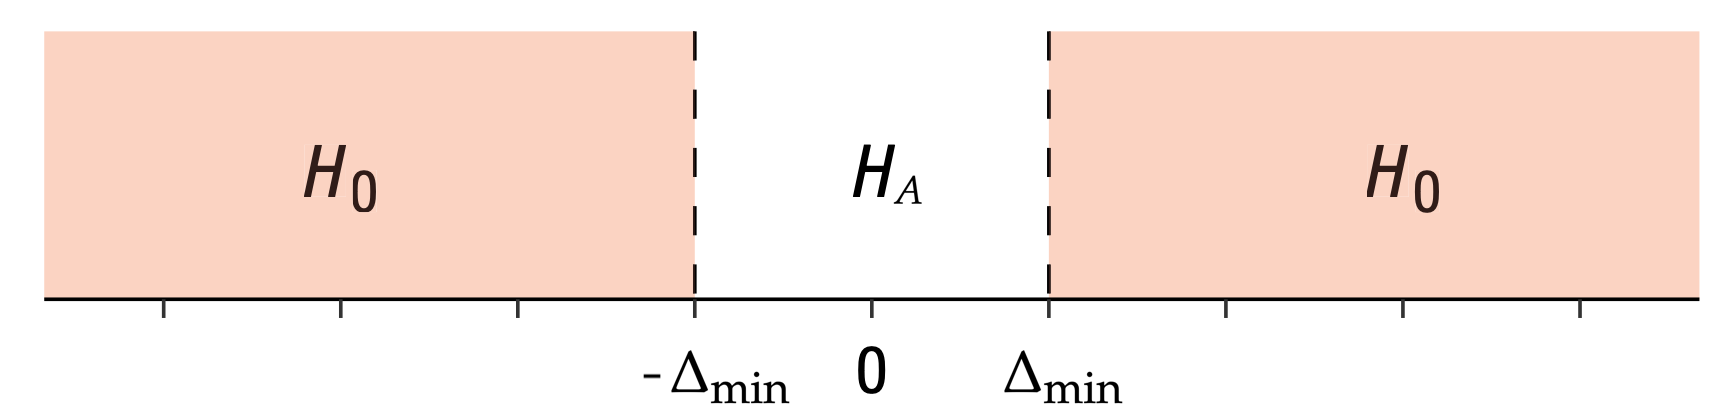
sesoi = 4Estimates
Compute the sample means , , and the difference between means .
Formulas
The estimated standard error of the difference between means estimator is
where and are the sample standard deviations.
Test statistic
Compute the -statistic .
Sampling distribution
Student’s -distribution with degrees of freedom,
where the degrees of freedom parameter is computed using
the helper function calcdf:
,
which implements the Welch--Satterthwaite formula.
P-value calculation
# from ministats import tost_dmeans

# %psource tost_dmeans
To perform the two-sample -test on the samples xs and ys,
we call tost_dmeans(xs, ys).
Examples
For all the examples we present below, we assume the unknown distribution are normally distributed
from scipy.stats import normExample A: populations are different
Suppose the -population is normally distributed with mean and standard deviation , while the -population is normally distributed with mean and standard deviation
muXA = 104
sigmaXA = 3
rvXA = norm(muXA, sigmaXA)

muYA = 100
sigmaYA = 5
rvYA = norm(muYA, sigmaYA)
Let’s generate a sample xAs and yAs of size from the random variables and .
np.random.seed(42)

# generate a random sample of size n=20 from rvX
n = 20
xAs = rvXA.rvs(n)

# generate a random sample of size m=20 from rvY
m = 20
yAs = rvYA.rvs(m)
xAs, yAs
(array([105.49014246, 103.5852071 , 105.94306561, 108.56908957,
103.29753988, 103.29758913, 108.73763845, 106.30230419,
102.59157684, 105.62768013, 102.60974692, 102.60281074,
104.72588681, 98.26015927, 98.8252465 , 102.31313741,
100.96150664, 104.942742 , 101.27592777, 99.7630889 ]),
array([107.32824384, 98.8711185 , 100.33764102, 92.87625907,
97.27808638, 100.55461295, 94.24503211, 101.87849009,
96.99680655, 98.54153125, 96.99146694, 109.26139092,
99.93251388, 94.71144536, 104.11272456, 93.89578175,
101.04431798, 90.20164938, 93.35906976, 100.98430618]))dhatA = np.mean(xAs) - np.mean(yAs)
dhatA4.815979892644748dAs = xAs - yAs
with plt.rc_context({"figure.figsize":(7,1)}):
sns.stripplot(x=dAs, jitter=0, alpha=0.5)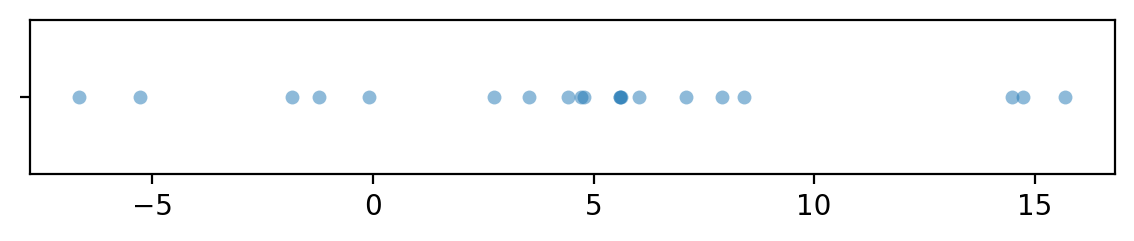
import seaborn as sns

with plt.rc_context({"figure.figsize":(7,1)}):
    sns.stripplot(x=xAs, jitter=0, alpha=0.5)
    sns.stripplot(x=yAs, jitter=0, alpha=0.5)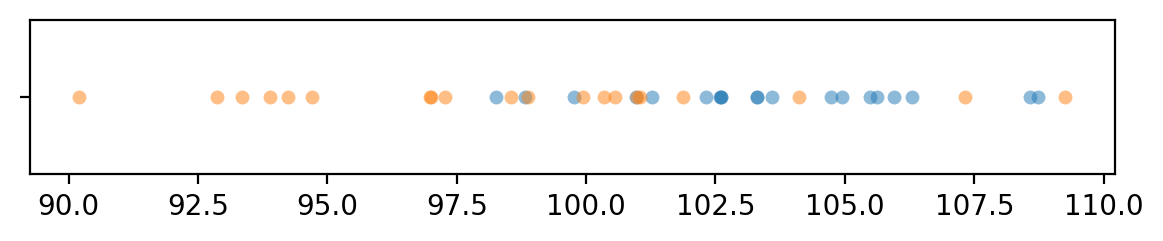
To obtain the -value, we first compute the observed -statistic, then calculate the tail probabilities in the two tails of the standard normal distribution .
from scipy.stats import t as tdist
from ministats import calcdf

# Calculate the sample statistics
from ministats import mean, std
obsdhat = mean(xAs) - mean(yAs)
sx, sy = std(xAs), std(yAs)

# Calculate the standard error and the t-statistic
seD = np.sqrt(sx**2/n + sy**2/m)

# Calculate the degrees of freedom
dfD = calcdf(sx, n, sy, m)

# Positive hypothesis test
obstplus = (obsdhat - sesoi) / seD
rvT0plus = tdist(df=dfD)
pvalueplus = rvT0plus.cdf(obstplus)
print("obst+", obstplus, "  pvalue+", pvalueplus)

# Negative hypothesis test
obstminus = (obsdhat - (-sesoi)) / seD
rvT0minus = tdist(df=dfD)
pvalueminus = 1 - rvT0minus.cdf(obstminus)
print("obst-", obstminus, "   pvalue-", pvalueminus)

# the p-value is the largest of the two subtests
pvalue = max(pvalueplus, pvalueminus)
pvalue
obst+ 0.6479055169799628 pvalue+ 0.7390885154632982
obst- 7.000076915517506 pvalue- 3.7301428501557155e-08
0.7390885154632982The helper function ttost_ind in the statsmodels module performs
exactly the same sequence of steps to compute the -value.
from statsmodels.stats.weightstats import ttost_ind

ttost_ind(xAs, yAs, low=-sesoi, upp=sesoi, usevar='unequal')
(0.7390885154633053,
(7.000076915517528, 3.730142848917544e-08, 30.95572939468825),
(0.6479055169799854, 0.7390885154633053, 30.95572939468825))The -value we obtain is 0.739, which is above the cutoff value , so our conclusion is we fail to reject the null hypothesis: the means of the two unknown populations differ significantly from the smallest effect size of interest .
Example B: sample from a population as expected under 
muXB = 100
sigmaXB = 5
rvXB = norm(muXB, sigmaXB)

muYB = muXB
sigmaYB = sigmaXB
rvYB = norm(muYB, sigmaYB)
Let’s generate a sample xs of size from the random variable ,
which has the same distribution as the theoretical distribution we expect under the null hypothesis.
np.random.seed(31)

# generate a random sample of size n=20 from rvX
n = 20
xBs = rvXB.rvs(n)

# generate a random sample of size m=20 from rvY
m = 20
yBs = rvYB.rvs(m)
# xBs, yBs
np.mean(xBs), np.mean(yBs)
(98.49345582110894, 99.90646412616485)obsdhatB = np.mean(xBs) - np.mean(yBs)
obsdhatB-1.4130083050559108sxB, syB = std(xBs), std(yBs)
# Calculate the standard error and the t-statistic
seDB = np.sqrt(sxB**2/n + syB**2/m)
seDB1.3075392073324235import seaborn as sns
with plt.rc_context({"figure.figsize":(7,1)}):
sns.stripplot(x=xBs, jitter=0, alpha=0.5)
sns.stripplot(x=yBs, jitter=0, alpha=0.5)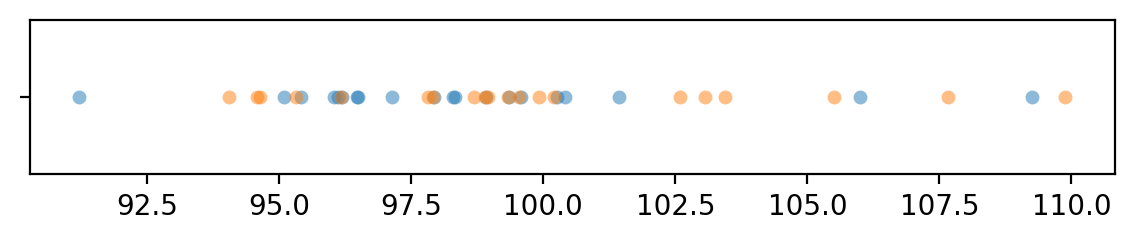
dfB = pd.DataFrame({"x": xBs, "y":yBs})
with plt.rc_context({"figure.figsize":(7,1)}):
    sns.stripplot(dfB, orient="h")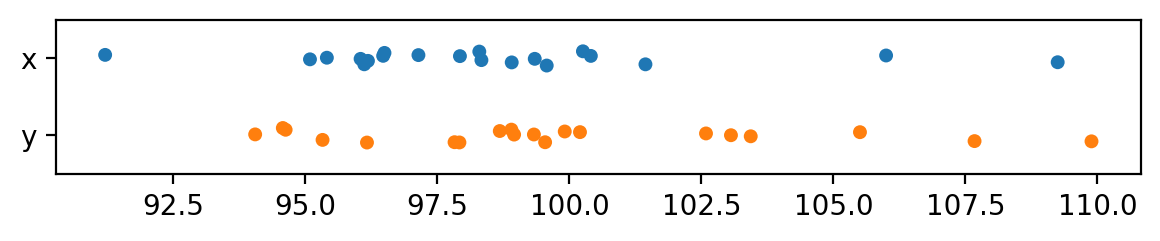
from scipy.stats import t as tdist
from ministats import calcdf

# Calculate the sample statistics
from ministats import mean, std
obsdhatB = mean(xBs) - mean(yBs)
print("obsdhatB =", obsdhatB)
sxB, syB = std(xBs), std(yBs)

# Calculate the standard error and the t-statistic
seDB = np.sqrt(sxB**2/n + syB**2/m)
print("seDB =", seDB, "  sesoi/seDB =", sesoi/seDB)

# Calculate the degrees of freedom
dfDB = calcdf(sxB, n, syB, m)
print("dfDB =", dfDB)

# Positive hypothesis test
obstplus = (obsdhatB - sesoi) / seDB
rvT0plus = tdist(df=dfDB)
pvalueplus = rvT0plus.cdf(obstplus)
print("obst+ =", obstplus, "  pvalue+ =", pvalueplus)

# Negative hypothesis test
obstminus = (obsdhatB - (-sesoi)) / seDB
rvT0minus = tdist(df=dfDB)
pvalueminus = 1 - rvT0minus.cdf(obstminus)
print("obst- =", obstminus, "   pvalue- =", pvalueminus)

# the p-value is the largest of the two sub-tests
pvalue = max(pvalueplus, pvalueminus)
pvalue
obsdhatB = -1.4130083050558824
seDB = 1.3075392073324235 sesoi/seDB = 3.0591816884486405
dfDB = 37.59083188299806
obst+ = -4.139843971561842 pvalue+ = 9.438014051414072e-05
obst- = 1.978519405335439 pvalue- = 0.02761615756744984
0.02761615756744984from statsmodels.stats.weightstats import ttost_ind
ttost_ind(xBs, yBs, low=-sesoi, upp=sesoi, usevar='unequal')(0.02761615756745112,
(1.978519405335417, 0.02761615756745112, 37.59083188299806),
(-4.139843971561863, 9.438014051413471e-05, 37.59083188299806))The -value we obtain is 0.0276, which is below the cutoff value so our conclusion is that we’ve reject the null hypothesis: this means of two samples are not significantly different.
Confidence interval for the effect size
from ministats import ci_dmeansThe confidence interval for the effect size in Example A is
ci_dmeans(xAs, yAs, alpha=0.1, method='a')[2.6805293784320785, 6.951430406857417]The confidence interval for the effect size in Example B is
ci_dmeans(xBs, yBs, alpha=0.1, method='a')[-3.6180594963139185, 0.7920428862020961]Related
Discussion
Links
Comprare with R
> install.packages("TOSTER")
> library(TOSTER)
> tsum_TOST(m1 = 98.49345582110894, sd1 = 3.913169794238548, n1 = 20,
+           m2 = 99.90646412616485, sd2 = 4.345144155915784, n2 = 20,
+           eqb = 4, alpha = 0.05, var.equal = FALSE)

Welch Modified Two-Sample t-Test
The equivalence test was significant, t(37.59) = 1.979, p = 2.76e-02
The null hypothesis test was non-significant, t(37.59) = -1.081, p = 2.87e-01
NHST: do not reject null significance hypothesis that the effect is equal to zero
TOST: reject null equivalence hypothesis

TOST Results
                t    df p.value
t-test     -1.081 37.59   0.287
TOST Lower  1.979 37.59   0.028
TOST Upper -4.140 37.59 < 0.001

Effect Sizes
               Estimate     SE              C.I. Conf. Level
Raw             -1.4130 1.3075  [-3.6181, 0.792]         0.9
Hedges g(av)    -0.3349 0.3412 [-0.8463, 0.1809]         0.9
Simulation to check TOST sensitivity
Let’s run a simulation to see how the accuracy of the TOST procedure
for detecting when two samples come from the same population.
We’ll use the standard normal as the population,
and run ttost_ind for different choices of sesoi and sample sizes n=m.
def one_equiv_test(mu, sigma, n, m, sesoi):
    """
    Run TOST on two samples from the same population.
    """
    # two identical populations
    muX, sigmaX = mu, sigma
    muY, sigmaY = mu, sigma
    rvX = norm(muX, sigmaX)
    rvY = norm(muY, sigmaY)

    # generate a random samples
    xs = rvX.rvs(n)
    ys = rvY.rvs(m)

    # run TOST
    p, _, _ = ttost_ind(xs, ys, low=-sesoi, upp=sesoi, usevar='unequal')
    return p


def replicate_many_equiv_tests(mu, sigma, n, m, sesoi, N=1000, cutoff=0.05):
    pvals = np.empty(N)
    for i in range(N):
        pval = one_equiv_test(mu=mu, sigma=sigma, n=n, m=m, sesoi=sesoi)
        pvals[i] = pval
    prop = sum(pvals < cutoff) / len(pvals)
    return prop


SIMULATE = False  # don't need to re-run simulation every time

if SIMULATE:
    np.random.seed(33)
    sesois = np.arange(0.2, 1.5, 0.1)
    ns = [20, 30, 40, 60, 100]
    results = pd.DataFrame(columns=["sesoi", "n", "prop"])
    for i, (sesoi, n) in enumerate(product(sesois, ns)):
        print(f"{i} running replicate_many_equiv_tests for {sesoi=} and {n=}")
        prop = replicate_many_equiv_tests(mu=0, sigma=1, n=n, m=n, sesoi=sesoi)
        results.loc[i] = [sesoi, n, prop]
else:
    results = pd.DataFrame.from_records(
        [  (0.2,  20., 0.   ), (0.2,  30., 0.   ), (0.2,  40., 0.   ),
           (0.2,  60., 0.   ), (0.2, 100., 0.   ), (0.3,  20., 0.   ),
           (0.3,  30., 0.   ), (0.3,  40., 0.   ), (0.3,  60., 0.025),
           (0.3, 100., 0.384), (0.4,  20., 0.001), (0.4,  30., 0.012),
           (0.4,  40., 0.115), (0.4,  60., 0.411), (0.4, 100., 0.747),
           (0.5,  20., 0.035), (0.5,  30., 0.203), (0.5,  40., 0.412),
           (0.5,  60., 0.723), (0.5, 100., 0.932), (0.6,  20., 0.186),
           (0.6,  30., 0.497), (0.6,  40., 0.704), (0.6,  60., 0.898),
           (0.6, 100., 0.992), (0.7,  20., 0.395), (0.7,  30., 0.708),
           (0.7,  40., 0.865), (0.7,  60., 0.971), (0.7, 100., 0.996),
           (0.8,  20., 0.606), (0.8,  30., 0.862), (0.8,  40., 0.94 ),
           (0.8,  60., 0.993), (0.8, 100., 1.   ), (0.9,  20., 0.761),
           (0.9,  30., 0.937), (0.9,  40., 0.975), (0.9,  60., 0.998),
           (0.9, 100., 1.   ), (1. ,  20., 0.853), (1. ,  30., 0.968),
           (1. ,  40., 0.998), (1. ,  60., 1.   ), (1. , 100., 1.   ),
           (1.1,  20., 0.927), (1.1,  30., 0.991), (1.1,  40., 0.999),
           (1.1,  60., 1.   ), (1.1, 100., 1.   ), (1.2,  20., 0.971),
           (1.2,  30., 0.998), (1.2,  40., 1.   ), (1.2,  60., 1.   ),
           (1.2, 100., 1.   ), (1.3,  20., 0.982), (1.3,  30., 0.999),
           (1.3,  40., 1.   ), (1.3,  60., 1.   ), (1.3, 100., 1.   ),
           (1.4,  20., 0.992), (1.4,  30., 1.   ), (1.4,  40., 1.   ),
           (1.4,  60., 1.   ), (1.4, 100., 1.   ) ],
        columns=["sesoi", "n", "prop"]
    )
TOST sensitivity results
ax = sns.lineplot(x=results["sesoi"], y=results["prop"], hue=results["n"])
ax.set_title("Proportion of TOST tests that correctly reject H0 \n for two samples of size n from a standard normal")
ax.set_ylabel("Proportion of TOST results with p < 0.05");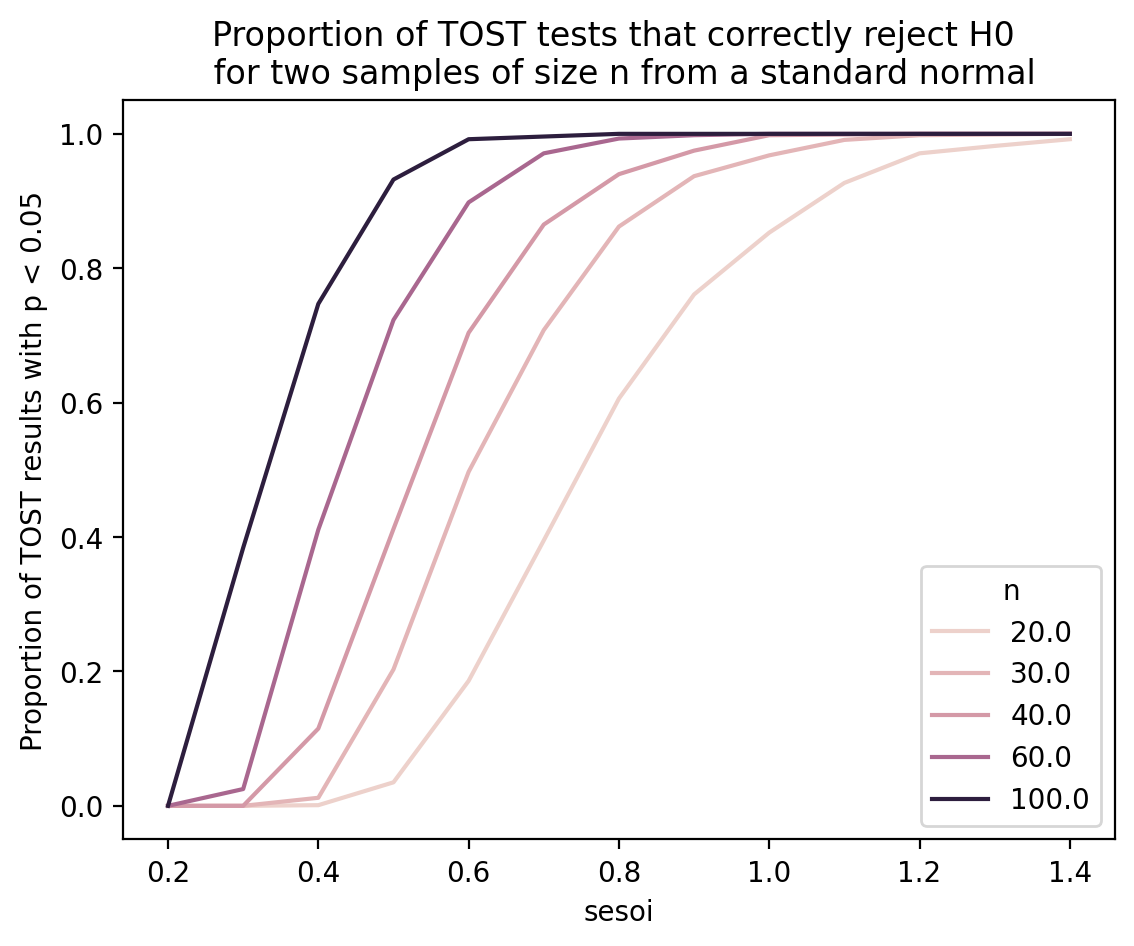
The above graph shows that, for we need to use sesoi of around 0.7 standard deviations if we want TOST to have 80% power at detecting the equivalence.
For we need sesoi to be 1 standard deviation if we want 80% power.