import matplotlib.pyplot as plt
import numpy as np
import seaborn as sns
%matplotlib inline
%config InlineBackend.figure_format = 'retina'
(this cell contains the macro definitions like , , , ...)
Definitions
Formulas
Example
Explanations
Discussion
Equivalence between ANOVA and OLS
via https://
import numpy as np
from scipy.stats import randint, norm
np.random.seed(124)  # Fix the seed

x = randint(1,6).rvs(100) # Generate 100 random integer U[1,5]
y = x + norm().rvs(100)   # Generate my response sample
import pandas as pd
import seaborn as sns
df = pd.DataFrame({"x":x, "y":y})
sns.stripplot(data=df, x="x", y="y")
df.groupby("x")["y"].mean()x
1 1.114427
2 1.958159
3 2.844082
4 4.198083
5 5.410594
Name: y, dtype: float64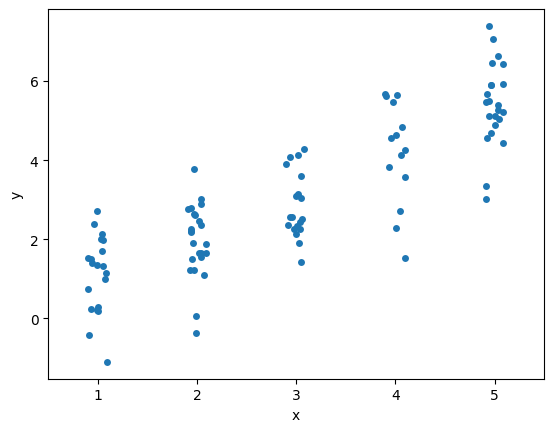
# One-way ANOVA
from scipy.stats import f_oneway

x1 = df[x==1]["y"]
x2 = df[x==2]["y"]
x3 = df[x==3]["y"]
x4 = df[x==4]["y"]
x5 = df[x==5]["y"]
res = f_oneway(x1, x2, x3, x4, x5)
res
F_onewayResult(statistic=62.07182379512491, pvalue=1.113218183344844e-25)import statsmodels.api as sm
from statsmodels.formula.api import ols
# get ANOVA table as R like output
model = ols('y ~ C(x)', data=df).fit()
anova_table = sm.stats.anova_lm(model, typ=2)
anova_tableLoading...
# MEANS
# 1    1.114427
# 2    1.958159
# 3    2.844082
# 4    4.198083
# 5    5.410594

# Ordinary Least Squares (OLS) model
model = ols('y ~ C(x)', data=df).fit()
model.summary()
Loading...
betas = model.params.values
betas
array([1.11442735, 0.84373124, 1.72965468, 3.0836561 , 4.29616654])scaled_batas = np.concatenate([[betas[0]], betas[0]+betas[1:]])
scaled_batasarray([1.11442735, 1.95815859, 2.84408203, 4.19808345, 5.41059388])# Check if the two results are numerically equivalent
np.isclose(scaled_batas, df.groupby("x")["y"].mean().values)array([ True, True, True, True, True])# # Ordinary Least Squares (OLS) model (no intercept)
# model = ols('y ~ C(x) -1', data=df).fit()
# model.summary()from scipy.stats.mstats import argstoarray
data = argstoarray(x1.values, x2.values, x3.values, x4.values, x5.values)data.count(axis=1)
np.sum( data.count(axis=1) * ( data.mean(axis=1) - data.mean() )**2 )250.9402371658938# sswg manual compute
gmeans = data.mean(axis=1)
data_minus_gmeans = np.subtract(data.T, gmeans).T
(data_minus_gmeans**2).sum()96.01507202947789# sswg via parallel axis thm
gmeans = data.mean(axis=1)
np.sum( (data**2).sum(axis=1) - data.count(axis=1) * gmeans**2 )96.01507202947788from scipy.stats import f as fdist
def f_oneway(*args):
"""
Performs a 1-way ANOVA, returning an F-value and probability given
any number of groups. From Heiman, pp.394-7.
"""
# Construct a single array of arguments: each row is a group
data = argstoarray(*args)
ngroups = len(data)
ntot = data.count()
sstot = (data**2).sum() - (data.sum())**2/float(ntot)
ssbg = (data.count(-1) * (data.mean(-1)-data.mean())**2).sum()
sswg = sstot-ssbg
print(ssbg, sswg, sstot)
dfbg = ngroups-1
dfwg = ntot - ngroups
msb = ssbg/float(dfbg)
msw = sswg/float(dfwg)
f = msb/msw
prob = fdist.sf(dfbg, dfwg, f)
return f, prob
f_oneway(x1.values, x2.values, x3.values, x4.values, x5.values)250.9402371658938 96.01507202947755 346.95530919537134
(62.07182379512513, 1.697371507321727e-08)