The goal of the one-sample -test to check if the mean of an unknown population ,
equals the mean of a theoretical distribution .
We’ll estimate the standard deviation from the sample standard deviation .
We discussed this hypothesis test in notebooks
import matplotlib.pyplot as plt
import numpy as np
import seaborn as sns
%matplotlib inline
%config InlineBackend.figure_format = 'retina'
(this cell contains the macro definitions like , , , ...)
Data
One sample of numerical observations .
Modeling assumptions
We model the unknown population as...
and the theoretical distribution is...
We assume the population is normally distributed , or the sample is large enough .
We also assume that the variance of the unknown population is known and equal to the variance of the theoretical population under
Hypotheses
and , where is the unknown population mean, is the theoretical mean we are comparing to.
Estimates
Calculate the sample mean and the sample standard deviation . We can then calculate the estimated standard error of the mean .
Test statistic
Compute from the sample mean , the theoretical population mean , the estimated standard error .
Sampling distribution
Student’s -distribution with degrees of freedom.
P-value calculation
from ministats import ttest_mean

%psource ttest_mean
def ttest_mean(sample, mu0, alt="two-sided"):
"""
T-test to detect mean deviation from a population with known mean `mu0`.
"""
assert alt in ["greater", "less", "two-sided"]
obsmean = np.mean(sample)
n = len(sample)
std = np.std(sample, ddof=1)
sehat = std / np.sqrt(n)
obst = (obsmean - mu0) / sehat
rvT = tdist(df=n-1)
pvalue = tailprobs(rvT, obst, alt=alt)
return pvalue
To perform the one-sample -test on the sample xs,
we call ttest_mean(xs, mu0=...),
with ... replaced by the expected mean of the theoretical population under
Examples
For all the examples we present below, we assume the theoretical distribution we expect under the null hypothesis, is normally distributed with mean and standard deviation :
from scipy.stats import norm
muX0 = 100
sigmaX0 = 5
rvX0 = norm(muX0, sigmaX0)
Example A: population different from 
Suppose the unknown population is normally distributed with mean and standard deviation :
muXA = 104
sigmaXA = 3
rvXA = norm(muXA, sigmaXA)
Let’s generate a sample xAs of size from the random variable .
np.random.seed(42)

# generate a random sample of size n=20
n = 20
xAs = rvXA.rvs(n)
xAs
array([105.49014246, 103.5852071 , 105.94306561, 108.56908957,
103.29753988, 103.29758913, 108.73763845, 106.30230419,
102.59157684, 105.62768013, 102.60974692, 102.60281074,
104.72588681, 98.26015927, 98.8252465 , 102.31313741,
100.96150664, 104.942742 , 101.27592777, 99.7630889 ])import seaborn as sns
with plt.rc_context({"figure.figsize":(7,1)}):
sns.stripplot(x=xAs, jitter=0, alpha=0.5)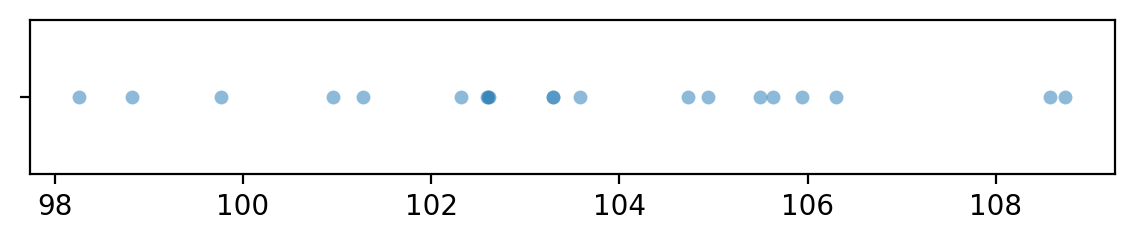
To obtain the -value, we first compute the observed -statistic, then calculate the tail probabilities in the two tails of the standard normal distribution .
from scipy.stats import t as tdist

obsmean = np.mean(xAs)
std = np.std(xAs, ddof=1)
sehat = std / np.sqrt(n)
obst = (obsmean - muX0) / sehat
rvT0 = tdist(df=n-1)
pvalue = rvT0.cdf(-obst) + 1-rvT0.cdf(obst)
obst, pvalue
(5.413149619618617, 3.186228235607658e-05)The helper function ttest_mean from the ministats module performs
exactly the same sequence of steps to compute the -value.
from ministats import ttest_mean
ttest_mean(xAs, mu0=muX0)3.1862282356088544e-05The -value we obtain is 0.00003186,
which is below the cutoff value ,
so our conclusion is we reject the null hypothesis:
the mean of the sample xAs is not statistically significantly different from the theoretically expected mean .
Example B: sample from a population as expected under 
# unknown population X = X0
rvXB = norm(muX0, sigmaX0)
Let’s generate a sample xBs of size from the random variable ,
which has the same distribution as the theoretical distribution we expect under the null hypothesis.
# np.random.seed(32)  produces false positie
np.random.seed(31)

# generate a random sample of size n=20
n = 20
xBs = rvXB.rvs(n)
xBs
array([ 97.92621393, 98.33315666, 100.40545993, 96.04486524,
98.90700164, 96.18401578, 96.11439878, 109.24678261,
96.47199845, 99.56978983, 101.43966651, 99.34306739,
95.08627924, 95.40604357, 105.99717245, 98.29312879,
91.20696344, 100.25558735, 97.14035504, 96.49716979])import seaborn as sns
with plt.rc_context({"figure.figsize":(7,1)}):
sns.stripplot(x=xBs, jitter=0, alpha=0.5)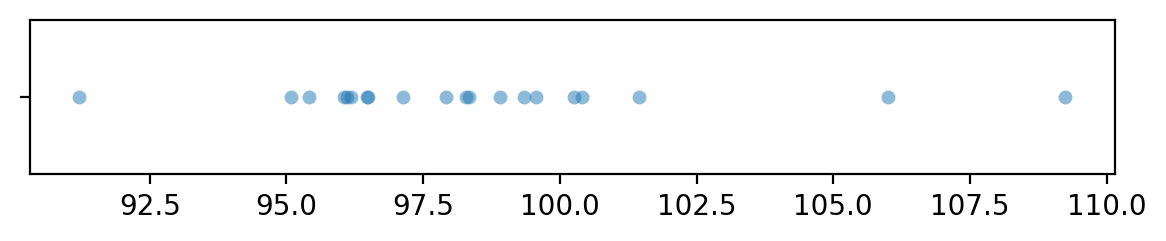
from ministats import ttest_mean
ttest_mean(xBs, mu0=muX0)0.1013574486082352The -value we obtain is 0.10, which is above the cutoff value
so our conclusion is that we’ve failed to reject the null hypothesis:
the mean of the sample xBs is not significantly different from the theoretically expected mean .
Confidence interval for the unknown mean
from ministats import ci_meanThe confidence interval for the unknown population mean in Example A is:
ci_mean(xAs, alpha=0.1, method='a')[102.3725312980782, 104.59967733327082]ci_mean(xBs, alpha=0.1, method='a')[96.98044495642183, 100.00646668579604]Effect size estimates
Related
Use the one-sample -test if the population standard deviation is known
Discussion
Links