This notebook contains the code examples from Section 4.6 Generalized linear models from the No Bullshit Guide to Statistics.
Notebook setup
# Ensure required Python modules are installed
%pip install --quiet numpy scipy seaborn pandas statsmodels ministats
Note: you may need to restart the kernel to use updated packages.
# Load Python modules
import matplotlib.pyplot as plt
import numpy as np
import pandas as pd
import seaborn as sns
# Figures setup
plt.clf() # needed otherwise `sns.set_theme` doesn't work
sns.set_theme(
context="paper",
style="whitegrid",
palette="colorblind",
rc={"font.family": "serif",
"font.serif": ["Palatino", "DejaVu Serif", "serif"],
"figure.figsize": (5,3)},
)
%config InlineBackend.figure_format = "retina"<Figure size 640x480 with 0 Axes># Simple float __repr__
if int(np.__version__.split(".")[0]) >= 2:
np.set_printoptions(legacy='1.25')# Download datasets/ directory if necessary
from ministats import ensure_datasets
ensure_datasets()datasets/ directory present and ready.
Definitions
Probability representations and link functions
Odds
0.5/(1-0.5), 0.9/(1-0.9), 0.2/(1-0.2)(1.0, 9.000000000000002, 0.25)Log-odds
np.log(0.5/(1-0.5)), np.log(0.9/(1-0.9)), np.log(0.2/(1-0.2))(0.0, 2.1972245773362196, -1.3862943611198906)The logit function
def logit(p):
    x = np.log(p / (1-p))
    return x

# ALT. import the function from `scipy.special`
from scipy.special import logit
logit(0.5), logit(0.9), logit(0.2)(0.0, 2.1972245773362196, -1.3862943611198906)ps = np.linspace(0, 1, 600)
ax = sns.lineplot(x=ps, y=logit(ps), label="$\\mathrm{logit}(p)$", color="C1")
ax.set_xlabel("$p$")
ax.set_ylabel("$x$");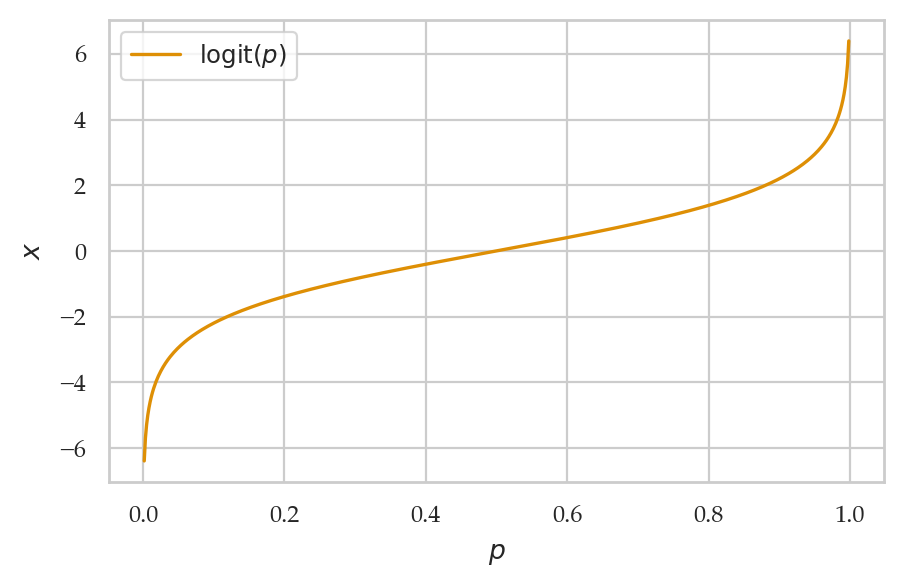
The logistic function
def expit(x):
    p = 1 / (1 + np.exp(-x))
    return p

# ALT. import the function from `scipy.special`
from scipy.special import expit
expit(0), expit(2), expit(-2)(0.5, 0.8807970779778823, 0.11920292202211755)xs = np.linspace(-6, 6, 500)
ax = sns.lineplot(x=xs, y=expit(xs), label="$\\mathrm{expit}(x)$")
ax.set_xlabel("$x$")
ax.set_ylabel("$p$");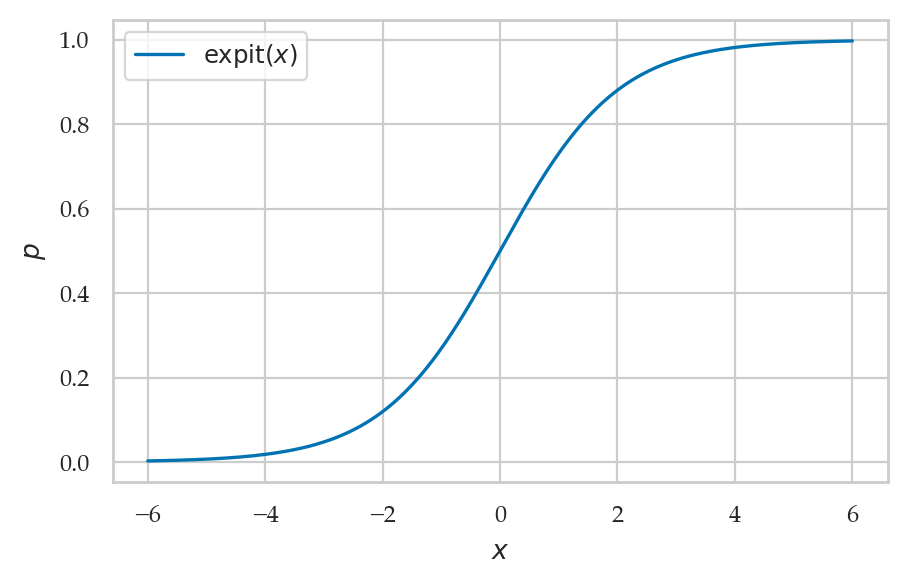
The logistic and logit functions are inverses
expit(logit(0.2))0.2logit(expit(3))3.000000000000003Logistic regression
TODO FORMULA
from scipy.stats import bernoulli
from scipy.special import expit

# Define the logistic regression model function
def expit_model(x):
    p = expit(-10 + 2*x)
    return p

xlims = [0, 10]
stem_half_width = 0.03

with sns.axes_style("ticks"):
    fig, ax = plt.subplots(figsize=(5, 3))

    # Plot the logistic regression model
    xs = np.linspace(xlims[0], xlims[1], 200)
    ps = expit_model(xs)
    sns.lineplot(x=xs, y=ps, ax=ax, label=r"$p(x) = \mathrm{expit}(\beta_0 + \beta_1x)$", linewidth=2)

    # Plot Bernoulli distributions at specified x positions
    x_positions = [2,4,5,6,8,10]
    for x_pos in x_positions:
        p_pos = expit_model(x_pos)
        ys = [0,1]
        pmf = bernoulli(p=p_pos).pmf(ys)
        ys_plot = [p_pos-stem_half_width, p_pos+stem_half_width]
        ax.stem(ys_plot, x_pos - pmf, bottom=x_pos, orientation='horizontal')

    # Figure setup
    ax.set_xlabel("$x$")
    ax.set_ylabel("$p$")
    ax.legend(loc="upper left")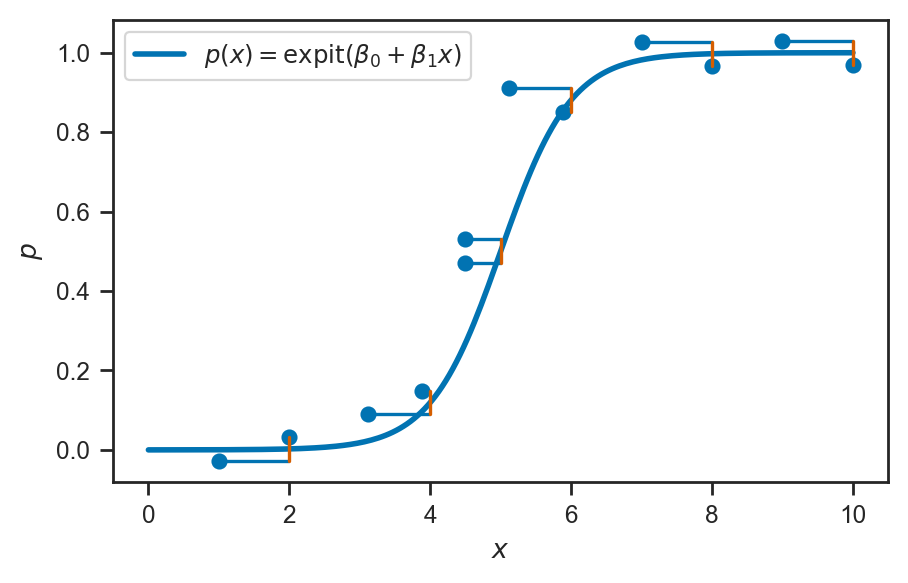
expit(-6)0.0024726231566347743expit(10)0.9999546021312976Example 1: hiring student interns
interns = pd.read_csv("datasets/interns.csv")
print(interns.shape)
interns.head(3)
(100, 2)
import statsmodels.formula.api as smf

lr1 = smf.logit("hired ~ 1 + work", data=interns).fit()
print(lr1.params)
Optimization terminated successfully.
Current function value: 0.138101
Iterations 10
Intercept -78.693205
work 1.981458
dtype: float64
lr1.summary()ax = sns.scatterplot(data=interns, x="work", y="hired")
wgrid = np.linspace(27, 50, 100)
hired_preds = lr1.predict({"work": wgrid})
sns.lineplot(x=wgrid, y=hired_preds, ax=ax);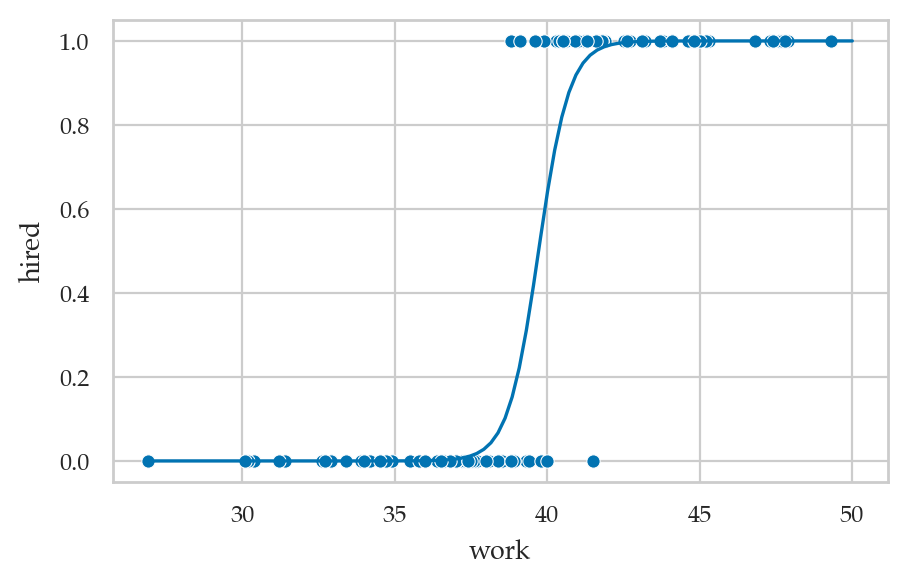
# ALT.
from ministats import plot_reg
plot_reg(lr1);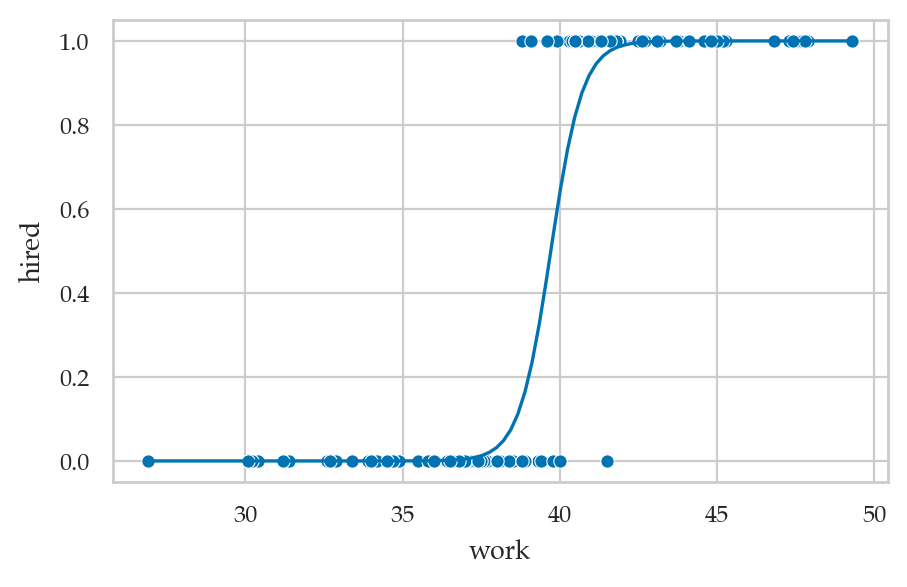
lr1.summary()Interpreting the model parameters
Parameters as changes in the log-odds
lr1.params["work"]1.9814577697476687Parameters as ratios of odds
np.exp(lr1.params["work"])7.253308936265722Differences in probabilities
What is the marginal effect of the predictor work
for an intern who invests 40 hours of effort?
# using `statsmodels`
lr1.get_margeff(atexog={1:40}).summary_frame()lr1.get_margeff(atexog={1:42}).summary_frame()# # ALT. manual calculation plugging into derivative of `expit`
# p40 = lr1.predict({"work":40}).item()
# marg_effect_at_40 = p40 * (1 - p40) * lr1.params['work']
# marg_effect_at_40Prediction
p42 = lr1.predict({"work":42})[0]
p420.9893134055105761Poisson regression
from scipy.stats import poisson

# Define the linear model function
def exp_model(x):
    lam = np.exp(1 + 0.2*x)
    return lam

onepixel = 0.07

xlims = [0, 20]
ylims = [0, 100]

with sns.axes_style("ticks"):
    fig, ax = plt.subplots(figsize=(5, 3))

    # Plot the linear model
    xs = np.linspace(xlims[0], xlims[1], 200)
    lams = exp_model(xs)
    sns.lineplot(x=xs, y=lams, ax=ax, label=r"$\mu_Y(x) = \exp(\beta_0 + \beta_1x)$", linewidth=2)

    # Plot Gaussian distributions at specified x positions and add sigma lines
    x_positions = range(2, xlims[1]-1, 3)
    for x_pos in x_positions:
        lam_pos = exp_model(x_pos)
        sigma = np.sqrt(lam_pos)
        ys_lower = int(lam_pos-2.5*sigma)
        ys_upper = int(lam_pos+3.4*sigma)
        ys = np.arange(ys_lower, ys_upper, 3)
        pmf = poisson(mu=lam_pos).pmf(ys)
        # ax.fill_betweenx(ys, x_pos - 2 * pmf * sigma, x_pos, color="grey", alpha=0.5)
        ax.stem(ys, x_pos- 2 * pmf * sigma, bottom=x_pos, orientation='horizontal')
        # Draw vertical sigma line and label it on the opposite side of the Gaussian shape
        # ax.plot([x_pos+onepixel, x_pos+onepixel], [lam_pos, lam_pos - sigma], "k", lw=1)
        # ax.text(x_pos + 0.1, lam_pos - sigma / 2 - 3*onepixel, r"$\sigma$", fontsize=12, va="center")

    # y-intercept
    ax.text(0 - 0.6, np.exp(1), r"$\exp(\beta_0)$", fontsize=10, va="center", ha="right")

    # Set up x-axis
    ax.set_xlim(xlims)
    ax.set_xlabel("$x$")
    ax.set_xticks(range(2, xlims[1], 3))
    ax.set_xticklabels([])

    # Set up y-axis
    ax.set_ylim([ylims[0]-4,ylims[1]])
    ax.set_ylabel("$y$")
    ax.set_yticks(list(range(ylims[0],ylims[1],20)) + [np.exp(1)] )
    ax.set_yticklabels([])

    ax.legend(loc="upper left")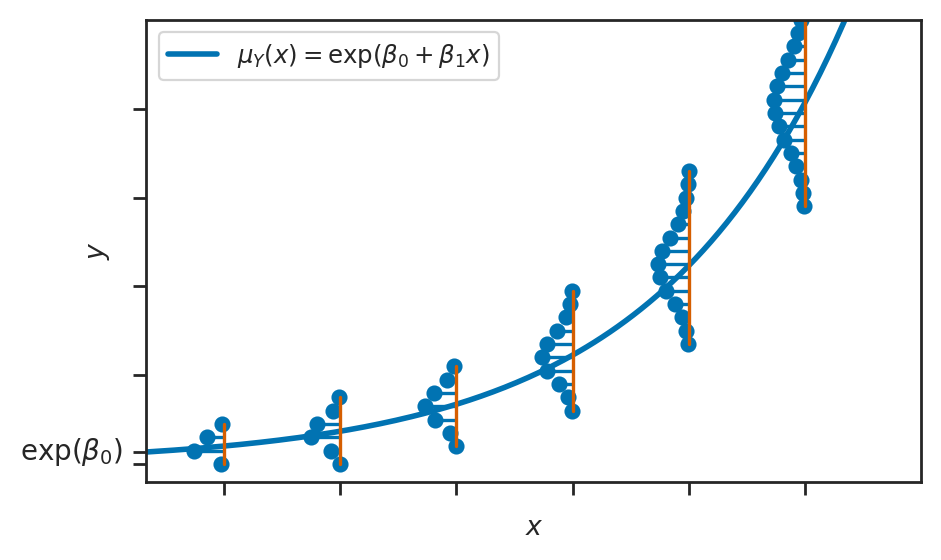
Example 2: hard disk failures over time
hdisks = pd.read_csv("datasets/hdisks.csv")
hdisks.head(3)import statsmodels.formula.api as smf
pr2 = smf.poisson("failures ~ 1 + age", data=hdisks).fit()
pr2.paramsOptimization terminated successfully.
Current function value: 2.693129
Iterations 6
Intercept    1.075999
age          0.193828
dtype: float64pr2.summary()from ministats import plot_reg
plot_reg(pr2);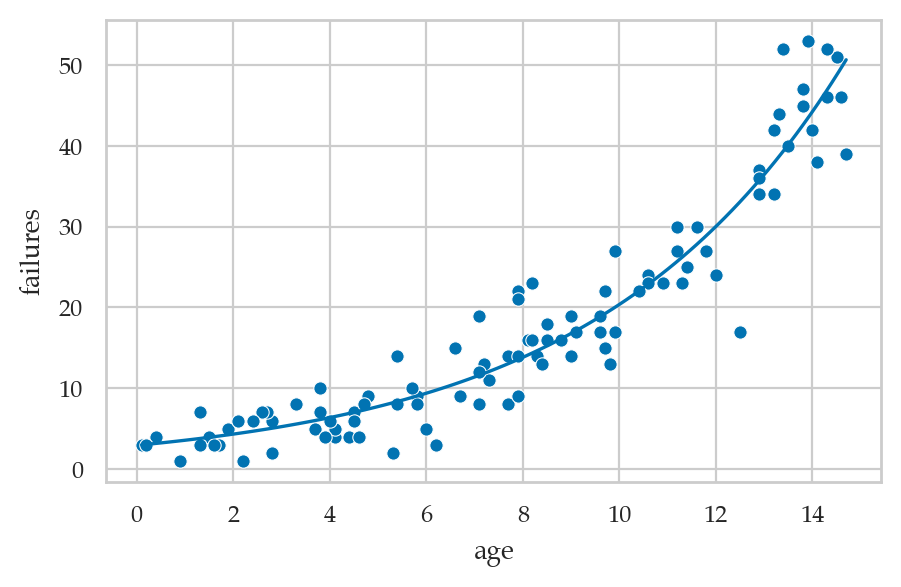
pr2.summary()Interpreting the model parameters
Log-counts
pr2.params["age"]0.1938278482145407Incidence rate ratio (IRR)
np.exp(pr2.params["age"])1.213887292102993Marginal effect
What is the marginal effect of the predictor age
for a 10 year old hard disk installation?
# using `statsmodels` .get_margeff() method
pr2.get_margeff(atexog={1:10}).summary_frame()# # ALT. manual calculation of the slope by evaluating the derivative
# b_0 = pr2.params['Intercept']
# b_age = pr2.params['age']
# np.exp(b_0 + b_age*10)*b_ageax = plot_reg(pr2)
# Show the tangent line at age=10 (the marginal effect)
ptx, pty = (10, pr2.predict({"age":10})[0])
slope = pr2.get_margeff(atexog={1:10}).margeff[0]
dx = 2
endpoint1 = [ptx - dx, pty - dx*slope]
endpoint2 = [ptx + dx, pty + dx*slope]
lines = [[endpoint1, endpoint2]]
from matplotlib import collections as mc
lc = mc.LineCollection(lines, color="r", lw=2)
ax.plot([ptx], [pty], marker="o", color="r", alpha=1)
ax.add_collection(lc);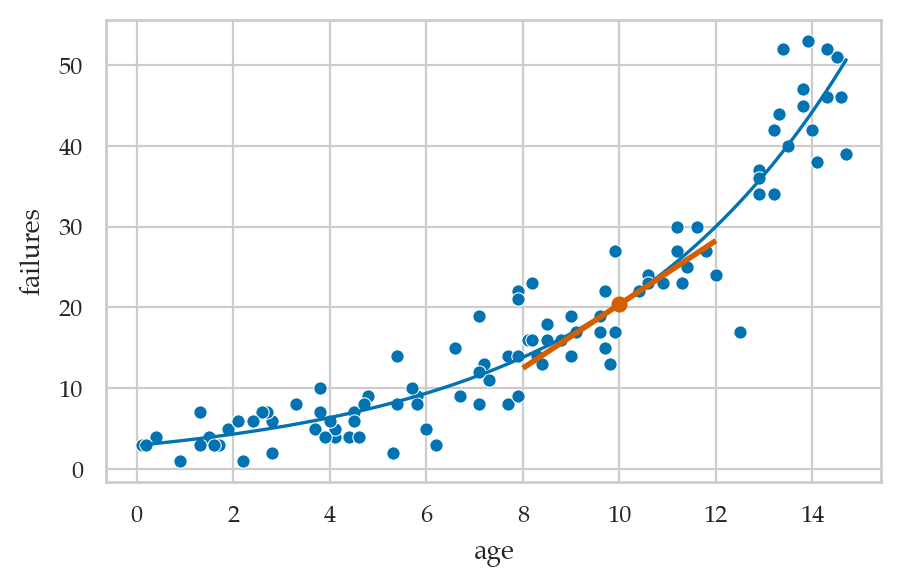
Predictions
lam10 = pr2.predict({"age":10})[0]
lam1020.374365915173986from scipy.stats import poisson
Hhat = poisson(mu=lam10)
Hhat.ppf(0.05), Hhat.ppf(0.95)(13.0, 28.0)Explanations
The exponential family of distributions
exponential
Gaussian (normal)
Poisson
Binomial
The generalized linear model template
choose
Generalized linear models using statsmodels
import statsmodels.api as sm

Norm = sm.families.Gaussian()
Bin = sm.families.Binomial()
Pois = sm.families.Poisson()
Linear model
students = pd.read_csv('datasets/students.csv')
formula0 = "score ~ 1 + effort"
glm0 = smf.glm(formula0, data=students, family=Norm).fit()
glm0.params
Intercept 32.465809
effort 4.504850
dtype: float64Logistic regression
formula1 = "hired ~ 1 + work"
glm1 = smf.glm(formula1, data=interns, family=Bin).fit()
glm1.params
# glm1.summary()
Intercept -78.693205
work 1.981458
dtype: float64Poisson regression
formula2 = "failures ~ 1 + age"
glm2 = smf.glm(formula2, data=hdisks, family=Pois).fit()
glm2.params
# glm2.summary()
Intercept 1.075999
age 0.193828
dtype: float64Fitting generalized linear models
Discussion
Model diagnostics and validation
# Dispersion from GLM attributes
# glm2.pearson_chi2 / glm2.df_resid
# Calculate Pearson chi-squared statistic
observed = hdisks['failures']
predicted = pr2.predict()
pearson_residuals = (observed - predicted) / np.sqrt(predicted)
pearson_chi2 = np.sum(pearson_residuals**2)
df_resid = pr2.df_resid
dispersion = pearson_chi2 / df_resid
print(f'Dispersion: {dispersion}')
# If dispersion > 1, consider Negative Binomial regressionDispersion: 0.9869289289681199
Logistic regression as a building blocks for neural networks
The operation of the perceptron, which is the basic building block of neural networks, is essentially the same as linear regression model:
constant intercept (bias term)
linear combination of inputs
nonlinear function used to force the output to be between 0 and 1
Limitations of GLMs
GLMs assume observations are independent
Assumes distribution is one of the exponential family
Outliers can be problematic
Interpretability
Exercises
Exercise 1: probabilities to odds and log-odds
0.3/(1-0.3), 0.99/(1-0.99), 0.7/(1-0.7)(0.4285714285714286, 98.99999999999991, 2.333333333333333)logit(0.3), logit(0.99), logit(0.7)(-0.8472978603872037, 4.595119850134589, 0.8472978603872034)Exercise 2: log-odds to probabilities
expit(-1), expit(1), expit(2)(0.2689414213699951, 0.7310585786300049, 0.8807970779778823)Exercise 3: students pass or fail
a) Load the dataset students.csv and add a column passing
that contains 1 or 0, based on the above threshold score of 70.
students = pd.read_csv('datasets/students.csv')
students["passing"] = (students["score"] > 70).astype(int)
# students.head()
b) Fit a logistic regression model for passing based on effort variable.
lmpass = smf.logit("passing ~ 1 + effort", data=students).fit()
lmpass.params
Optimization terminated successfully.
Current function value: 0.276583
Iterations 8
Intercept   -16.257302
effort        2.047882
dtype: float64
efforts = np.linspace(0, 13, 100)
passing_preds = lmpass.predict({"effort": efforts})
ax = sns.scatterplot(data=students, x="effort", y="passing", alpha=0.3)
sns.lineplot(x=efforts, y=passing_preds, ax=ax);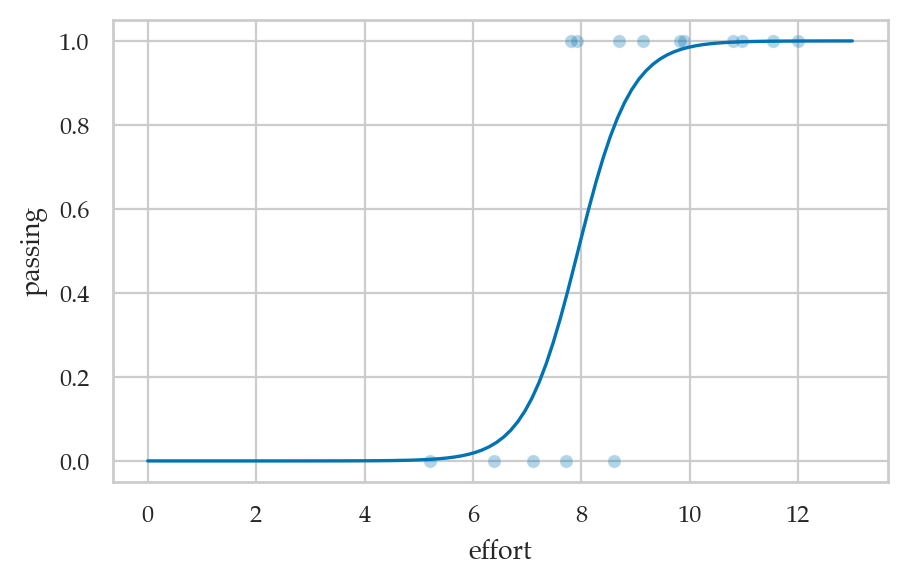
c) Use your model to predict the probability of a new student with effort 10 will pass.
lmpass.predict({"effort":10})0 0.985536
dtype: float64# ALT. compute prediction manually
intercept, b_effort = lmpass.params
expit(intercept + b_effort*10)0.9855358765361845Exercise 4: titanic survival data
Fit a logistic regression model that calculates the probability of survival for people who were on the Titanic,
based on the data in datasets/exercises/titanic.csv. Use the variables age, sex, and pclass as predictors.
titanic = pd.read_csv('datasets/exercises/titanic.csv')
formula = "survived ~ age + C(sex) + C(pclass)"
lrtitanic = smf.logit(formula, data=titanic).fit()
lrtitanic.params
Optimization terminated successfully.
Current function value: 0.453279
Iterations 6
Intercept         3.777013
C(sex)[T.M]      -2.522781
C(pclass)[T.2]   -1.309799
C(pclass)[T.3]   -2.580625
age              -0.036985
dtype: float64
Use your logistic regression model to estimate the probability of survival for a 30 year old female traveling in second class.
pass30Fpclass2 = {"age":30, "sex":"F", "pclass":2}
lrtitanic.predict(pass30Fpclass2)
0 0.795378
dtype: float64# # Cross check with sklearn
# from sklearn.linear_model import LogisticRegression
# df = pd.get_dummies(titanic, columns=['sex', 'pclass'], drop_first=True)
# X, y = df.drop('survived', axis=1), df['survived']
# sktitanic = LogisticRegression(penalty=None)
# sktitanic.fit(X, y)
# sktitanic.intercept_, sktitanic.coef_Exercise 5: asthma attacks
Fit a Poisson regression model to the datasets/exercises/asthma.csv dataset.
data source data/asthma.csv
asthma = pd.read_csv("datasets/exercises/asthma.csv")
asthmaformula_asthma = "attack ~ 1 + C(gender) + C(res_inf) + ghq12"
prasthma = smf.poisson(formula_asthma, data=asthma).fit()
prasthma.paramsOptimization terminated successfully.
Current function value: 1.707281
Iterations 6
Intercept           -0.315387
C(gender)[T.male]   -0.041905
C(res_inf)[T.yes]    0.426431
ghq12                0.049508
dtype: float64Exercise 6: student admissions dataset
The dataset datasets/exercises/binary.csv contains information
about the acceptance decision for 400 students to a prestigious school.
Try to fit a logistic regression model for the variable admit
using the variables gre, gpa, and rank as predictors.
# ORIGINAL https://stats.idre.ucla.edu/stat/data/binary.csv
binary = pd.read_csv('datasets/exercises/binary.csv')
binary.head(3)lrbinary = smf.logit('admit ~ gre + gpa + C(rank)', data=binary).fit()
lrbinary.paramsOptimization terminated successfully.
Current function value: 0.573147
Iterations 6
Intercept      -3.989979
C(rank)[T.2]   -0.675443
C(rank)[T.3]   -1.340204
C(rank)[T.4]   -1.551464
gre             0.002264
gpa             0.804038
dtype: float64
The above model uses the rank=1 as the reference category an the log odds reported are with respect to this catrgory
etc. for others rank[T.3] -1.340204 rank[T.4] -1.551464
See LogisticRegressionChangeOfReferenceCategoricalValue
# # Cross check with sklearn
# from sklearn.linear_model import LogisticRegression
# df = pd.get_dummies(binary, columns=['rank'], drop_first=True)
# X, y = df.drop("admit", axis=1), df["admit"]
# lr = LogisticRegression(solver="lbfgs", penalty=None, max_iter=1000)
# lr.fit(X, y)
# lr.intercept_,  lr.coef_
Exercise 7: ship accidents
https://
https://
https://
# TODOLinks
TODO
CUT MATERIAL
Bonus Exercises
Bonus exercise A: honors class
honors = pd.read_csv("datasets/exercises/honors.csv")
honors.sample(4)Constant model
lrhon1 = smf.logit("hon ~ 1", data=honors).fit()
lrhon1.params
Optimization terminated successfully.
Current function value: 0.556775
Iterations 5
Intercept   -1.12546
dtype: float64expit(lrhon1.params["Intercept"])0.24500000000000005honors["hon"].value_counts(normalize=True)hon
0 0.755
1 0.245
Name: proportion, dtype: float64Using only a categorical variable
lrhon2 = smf.logit("hon ~ 1 + female", data=honors).fit()
lrhon2.params
Optimization terminated successfully.
Current function value: 0.549016
Iterations 5
Intercept   -1.470852
female       0.592782
dtype: float64
pd.crosstab(honors["hon"], honors["female"], margins=True)b0 = lrhon2.params["Intercept"]
b_female = lrhon2.params["female"]# male prob
expit(b0), 17/91(0.18681318681318684, 0.18681318681318682)# male odds
np.exp(b0), 17/74 # = (17/91) / (74/91)(0.2297297297297298, 0.22972972972972974)# male log-odds
b0, np.log(17/74)(-1.4708517491479534, -1.4708517491479536)# female prob
expit(b0 + b_female), 32/109(0.29357798165137605, 0.29357798165137616)# female odds
np.exp(b0 + b_female), 32/77 # = (32/109) / (77/109)(0.41558441558441545, 0.4155844155844156)b0 + b_female, np.log(32/77)(-0.8780695190539576, -0.8780695190539572)# odds female relative to male
np.exp(b_female)1.8090145148968668Logistic regression with a single continuous predictor variable
lrhon3 = smf.logit("hon ~ 1 + math", data=honors).fit()
lrhon3.params
Optimization terminated successfully.
Current function value: 0.417683
Iterations 7
Intercept   -9.793942
math         0.156340
dtype: float64
So the model equation is
# Increase in log-odds between math=54 and math=55
p54 = lrhon3.predict({"math":[54]}).item()
p55 = lrhon3.predict({"math":[55]}).item()
logit(p55) - logit(p54), lrhon3.params["math"]
(0.15634035558592174, 0.15634035558592269)We can say now that the coefficient for math is the difference in the log odds. In other words, for a one-unit increase in the math score, the expected change in log odds is .1563404.
# Increase (multiplicative) in odds for unit increase in math
np.exp(lrhon3.params["math"]),  (p55/(1-p55)) / (p54/(1-p54))
(1.1692240873242834, 1.1692240873242823)So we can say for a one-unit increase in math score, we expect to see about 17% increase in the odds of being in an honors class. This 17% of increase does not depend on the value that math is held at.
Logistic regression with multiple predictor variables and no interaction terms
lrhon4 = smf.logit("hon ~ 1 + math + female + read", data=honors).fit()
lrhon4.params
Optimization terminated successfully.
Current function value: 0.390424
Iterations 7
Intercept   -11.770246
math          0.122959
female        0.979948
read          0.059063
dtype: float64
Logistic regression with an interaction term of two predictor variables
lrhon5 = smf.logit("hon ~ 1 + math + female + femalexmath", data=honors).fit()
lrhon5.params
Optimization terminated successfully.
Current function value: 0.399417
Iterations 7
Intercept     -8.745841
math           0.129378
female        -2.899863
femalexmath    0.066995
dtype: float64
# ALT. without using `femalexmath` column
# lrhon5 = smf.logit("hon ~ 1 + math + female + female*math", data=honors).fit()
# lrhon5.paramsBonus exercise: LA high schools (NOT A VERY GOOD FIT FOR POISSON MODEL)
Dataset info:
http://
This dataset consists of data from computer exercises collected from two high school in the Los Angeles area.
lahigh_raw = pd.read_stata("https://stats.idre.ucla.edu/stat/stata/notes/lahigh.dta")
lahigh = lahigh_raw.convert_dtypes()

lahigh["gender"] = lahigh["gender"].astype(object).replace({1:"F", 2:"M"})
lahigh["ethnic"] = lahigh["ethnic"].astype(object).replace({
    1:"Native American",
    2:"Asian",
    3:"African-American",
    4:"Hispanic",
    5:"White",
    6:"Filipino",
    7:"Pacific Islander"})
lahigh["school"] = lahigh["school"].astype(object).replace({1:"Alpha", 2:"Beta"})
lahigh.head()formula = "daysabs ~ 1 + mathnce + langnce + C(gender)"
prlahigh = smf.poisson(formula, data=lahigh).fit()
prlahigh.paramsOptimization terminated successfully.
Current function value: 4.898642
Iterations 5
Intercept         2.687666
C(gender)[T.M]   -0.400921
mathnce          -0.003523
langnce          -0.012152
dtype: float64
# IRR
np.exp(prlahigh.params[1:])C(gender)[T.M] 0.669703
mathnce 0.996483
langnce 0.987921
dtype: float64# CI for IRR F
np.exp(prlahigh.conf_int().loc["C(gender)[T.M]"])0 0.609079
1 0.736361
Name: C(gender)[T.M], dtype: float64# prlahigh.summary()
# prlahigh.aic, prlahigh.bicDiagnostics
via https://
prdiag = prlahigh.get_diagnostic()
# Plot observed versus predicted frequencies for entire sample
# prdiag.plot_probs();

# Other:
# ['plot_probs',
#  'probs_predicted',
#  'results',
#  'test_chisquare_prob',
#  'test_dispersion',
#  'test_poisson_zeroinflation',
#  'y_max']
# Code to get exactly the same numbers as in
# https://stats.oarc.ucla.edu/stata/output/poisson-regression/
formula2 = "daysabs ~ 1 + mathnce + langnce + C(gender, Treatment(1))"
prlahigh2 = smf.poisson(formula2, data=lahigh).fit()
prlahigh2.paramsOptimization terminated successfully.
Current function value: 4.898642
Iterations 5
Intercept                       2.286745
C(gender, Treatment(1))[T.F]    0.400921
mathnce                        -0.003523
langnce                        -0.012152
dtype: float64