This notebook contains the code examples from Section 4.1 Simple linear regression from the No Bullshit Guide to Statistics.
Notebook setup
# Ensure required Python modules are installed
%pip install --quiet numpy scipy seaborn pandas statsmodels ministats
[notice] A new release of pip is available: 26.2.1 -> 26.2.2
[notice] To update, run: pip install --upgrade pip
Note: you may need to restart the kernel to use updated packages.
# load Python modules
import numpy as np
import pandas as pd
import seaborn as sns
import matplotlib.pyplot as plt
from ministats.plots.figures import plot_residuals
from ministats.plots.figures import plot_residuals2# Figures setup
plt.clf() # needed otherwise `sns.set_theme` doesn't work
sns.set_theme(
context="paper",
style="whitegrid",
palette="colorblind",
rc={"font.family": "serif",
"font.serif": ["Palatino", "DejaVu Serif", "serif"],
"figure.figsize": (5, 3)},
)
%config InlineBackend.figure_format = "retina"<Figure size 640x480 with 0 Axes># Simple float __repr__
if int(np.__version__.split(".")[0]) >= 2:
np.set_printoptions(legacy='1.25')
# set random seed for repeatability
np.random.seed(42)# Download datasets/ directory if necessary
from ministats import ensure_datasets
ensure_datasets()datasets/ directory already exists.
import warnings
# silence kurtosistest warning when using n < 20
warnings.filterwarnings("ignore", category=UserWarning)
(this cell contains the macro definitions like , , , ...)
Definitions
TODO: add definitions
Linear model
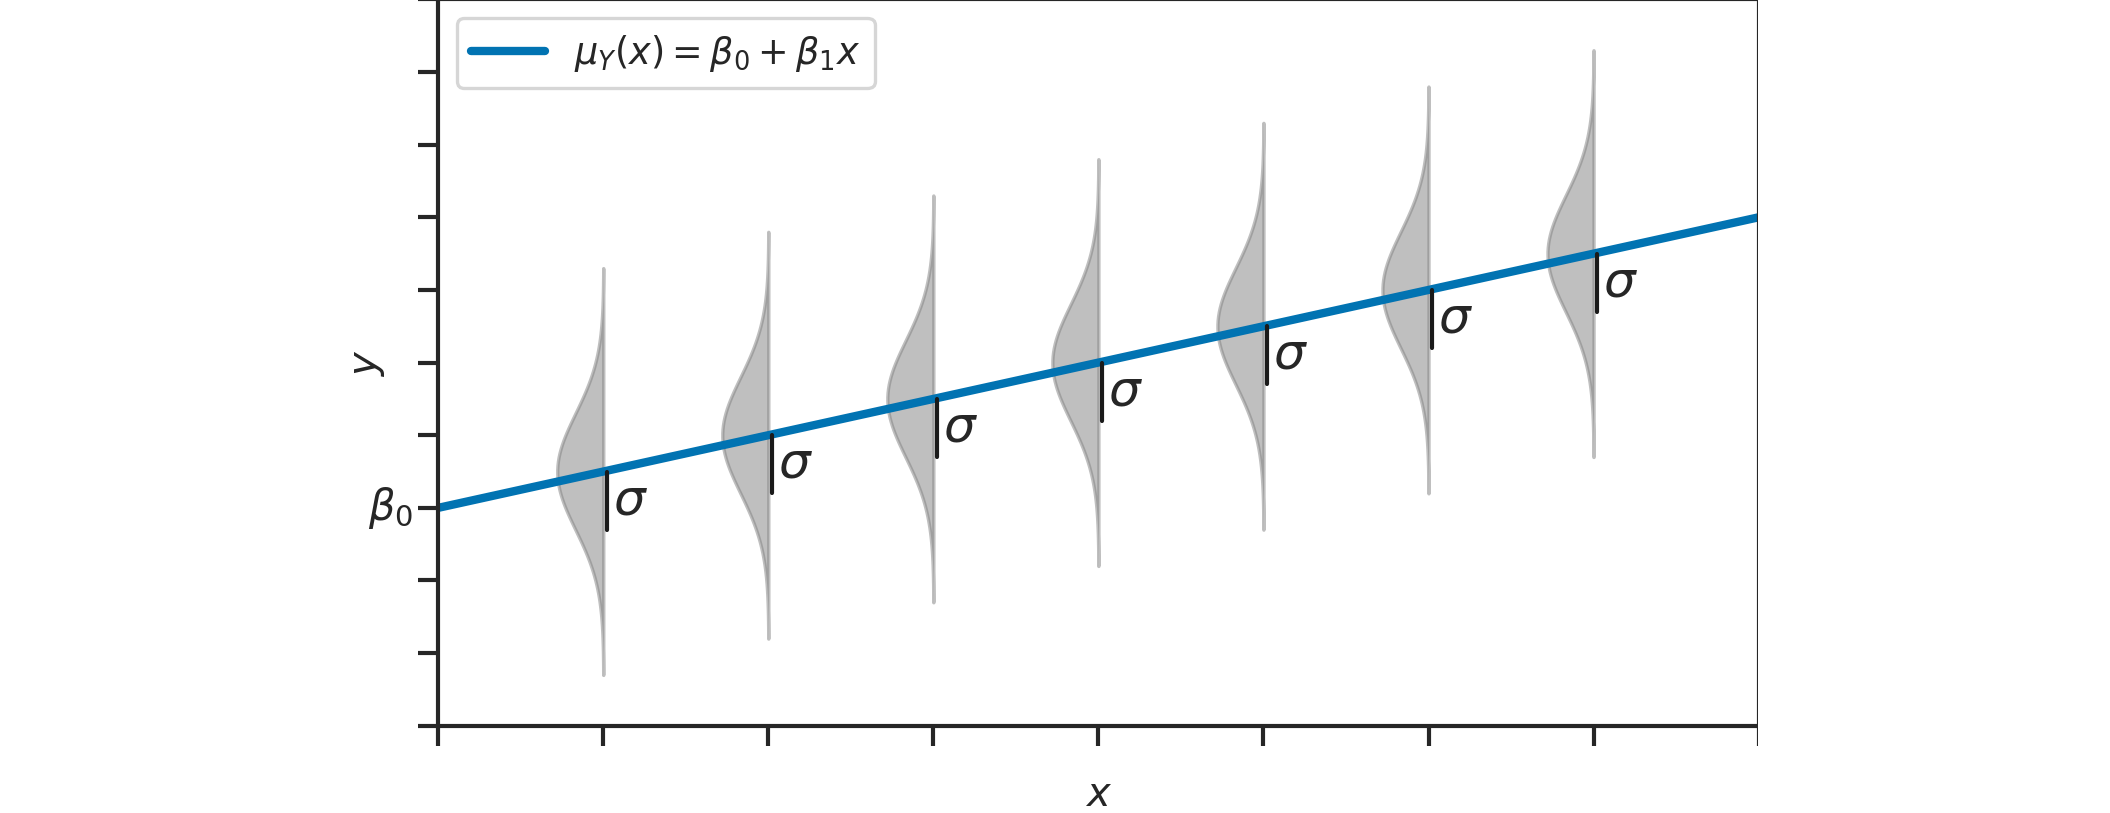
Example: students score as a function of effort
students = pd.read_csv("datasets/students.csv")
students.head()efforts = students["effort"]
scores = students["score"]
sns.scatterplot(x=efforts, y=scores);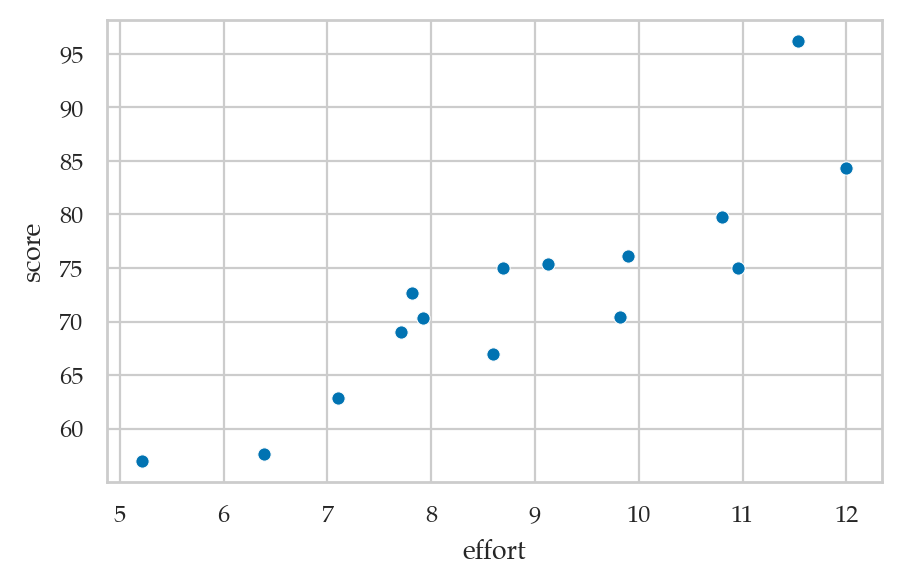
Compute the correlation
np.corrcoef(efforts, scores)[0,1]
# ALT. students[["effort","score"]].corr()
# np.corrcoef0.8794375135614694Parameter estimation using least squares
meaneffort = efforts.mean()
meanscore = scores.mean()
num = np.sum( (efforts-meaneffort)*(scores-meanscore) )
denom = np.sum( (efforts - meaneffort)**2 )
b1 = num / denom
b14.504850344209071b0 = meanscore - b1*meaneffort
b032.46580930159963es = np.linspace(5, 12)
scorehats = b0 + b1*es
sns.lineplot(x=es, y=scorehats)
sns.scatterplot(x=efforts, y=scores);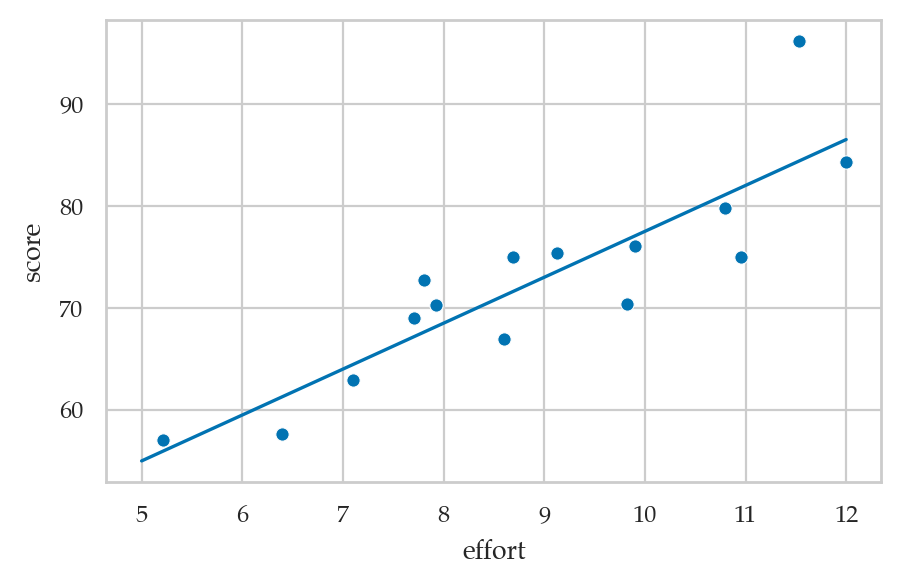
# # ALT.
# sns.regplot(x=efforts, y=scores, ci=None);
Least squares optimization for the parameters
How do we find the parameter estimates of the model?
plot_residuals(efforts, scores, b0, b1)
sns.scatterplot(x=efforts, y=scores)
es = np.linspace(5, 12.2)
scorehats = b0 + b1*es
sns.lineplot(x=es, y=scorehats, color="C4");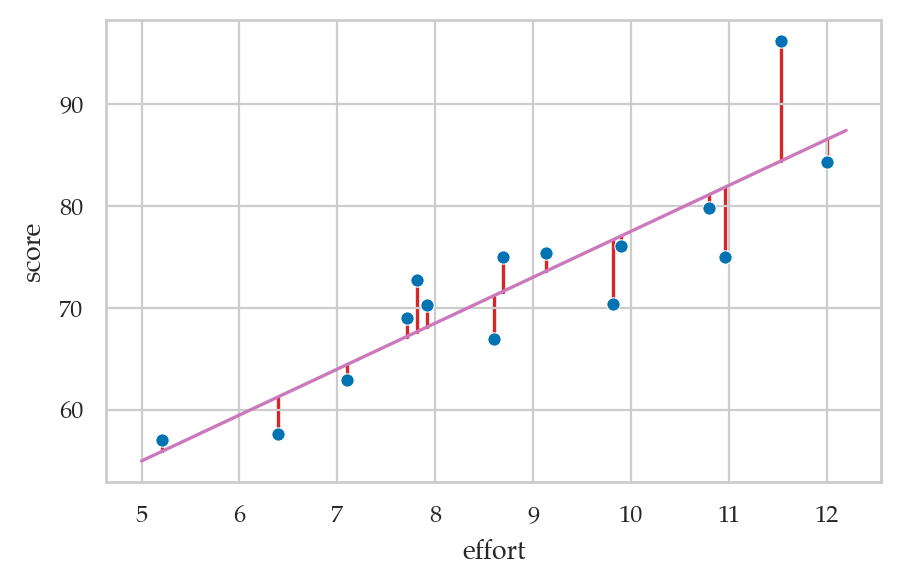
ax = sns.scatterplot(x=efforts, y=scores, zorder=4)
es = np.linspace(5, 12.2)
scorehats = b0 + b1*es
sns.lineplot(x=es, y=scorehats, color="C4", zorder=5)
plot_residuals2(efforts, scores, b0, b1, ax=ax);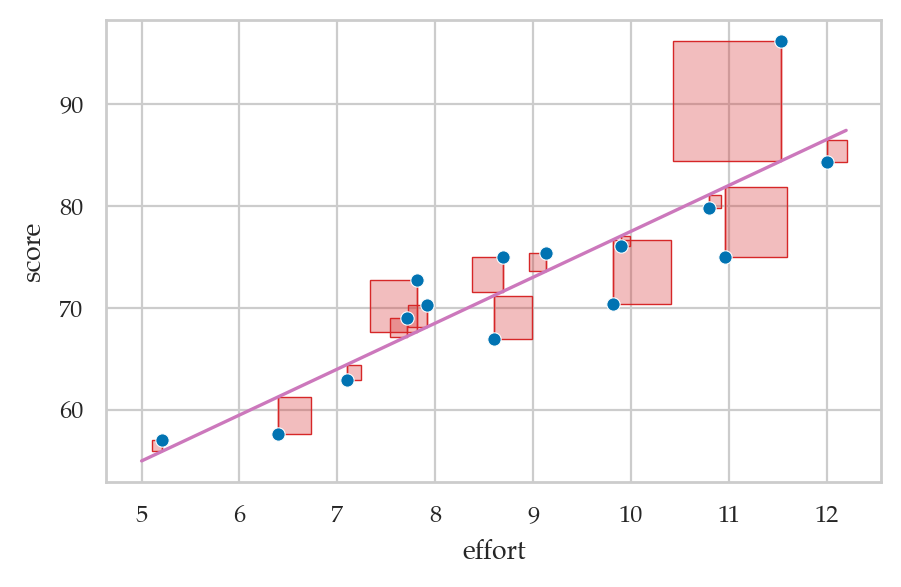
Estimating the standard deviation parameter
scorehats = b0 + b1*efforts
residuals = scores - scorehats
residuals[0:4]
0 -6.838969
1 3.387041
2 -4.207522
3 2.155776
dtype: float64SSR = np.sum( residuals**2 )
n = len(students)
sigmahat = np.sqrt( SSR / (n-2) )
sigmahat4.929598282660258Model diagnostics
Scatter plots
sns.scatterplot(x="effort", y="score", data=students);Examples of nonlinear patterns
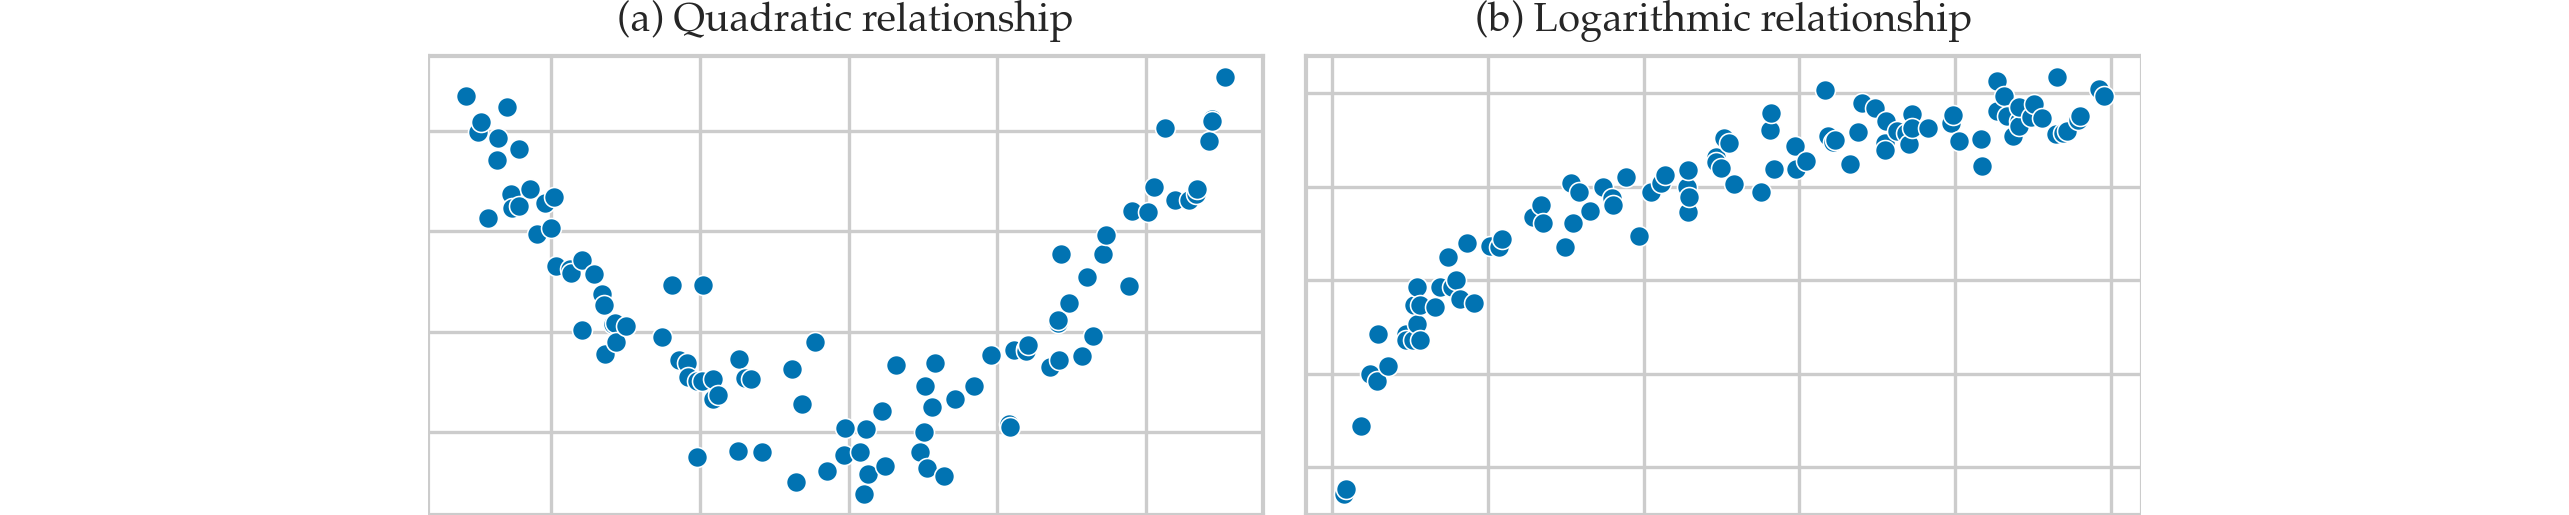
Residuals plots
scorehats = b0 + b1*efforts
residuals = scores - scorehats
Residuals versus the predicted values
ax = sns.scatterplot(x=scorehats, y=residuals)
ax.set_xlabel("model predictions ($\\hat{s}_i$)")
ax.set_ylabel("residuals ($r_i = s_i - \\hat{s}_i$)")
ax.axhline(y=0, color="b", linestyle="dotted");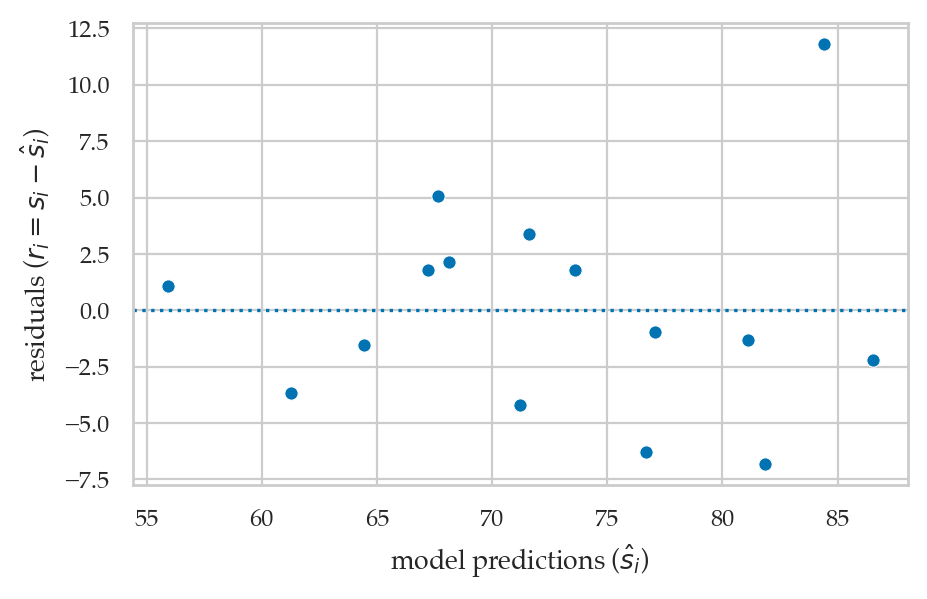
Residuals versus the predictor (bonus)
# ax = sns.scatterplot(x=efforts, y=residuals)
# ax.set_xticks(range(5,12+1))
# ax.set_ylabel("residuals ($r_i = s_i - \\hat{s}_i$)")
# ax.axhline(y=0, color="b", linestyle="dotted");
QQ-plot of the residuals
from statsmodels.graphics.api import qqplot

qqplot(residuals, line="q");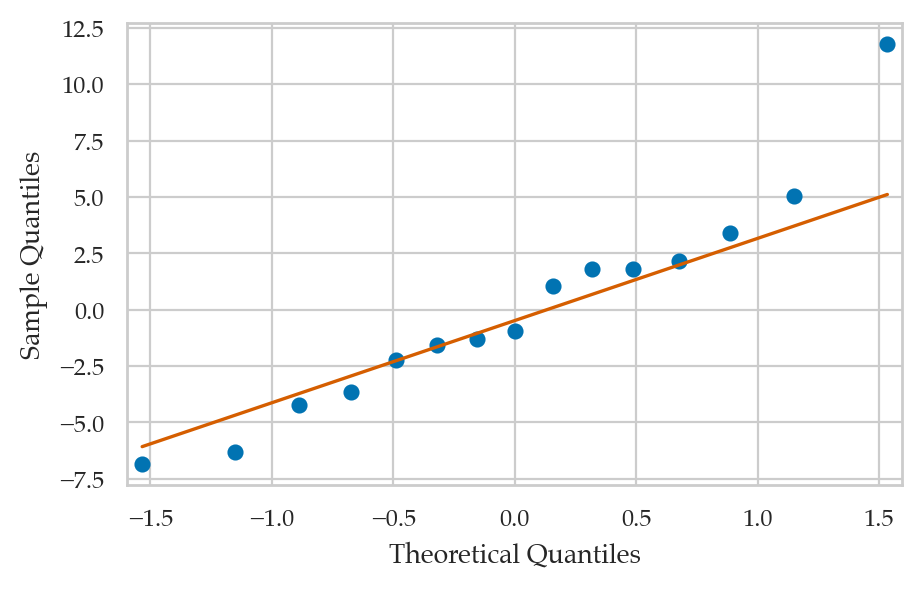
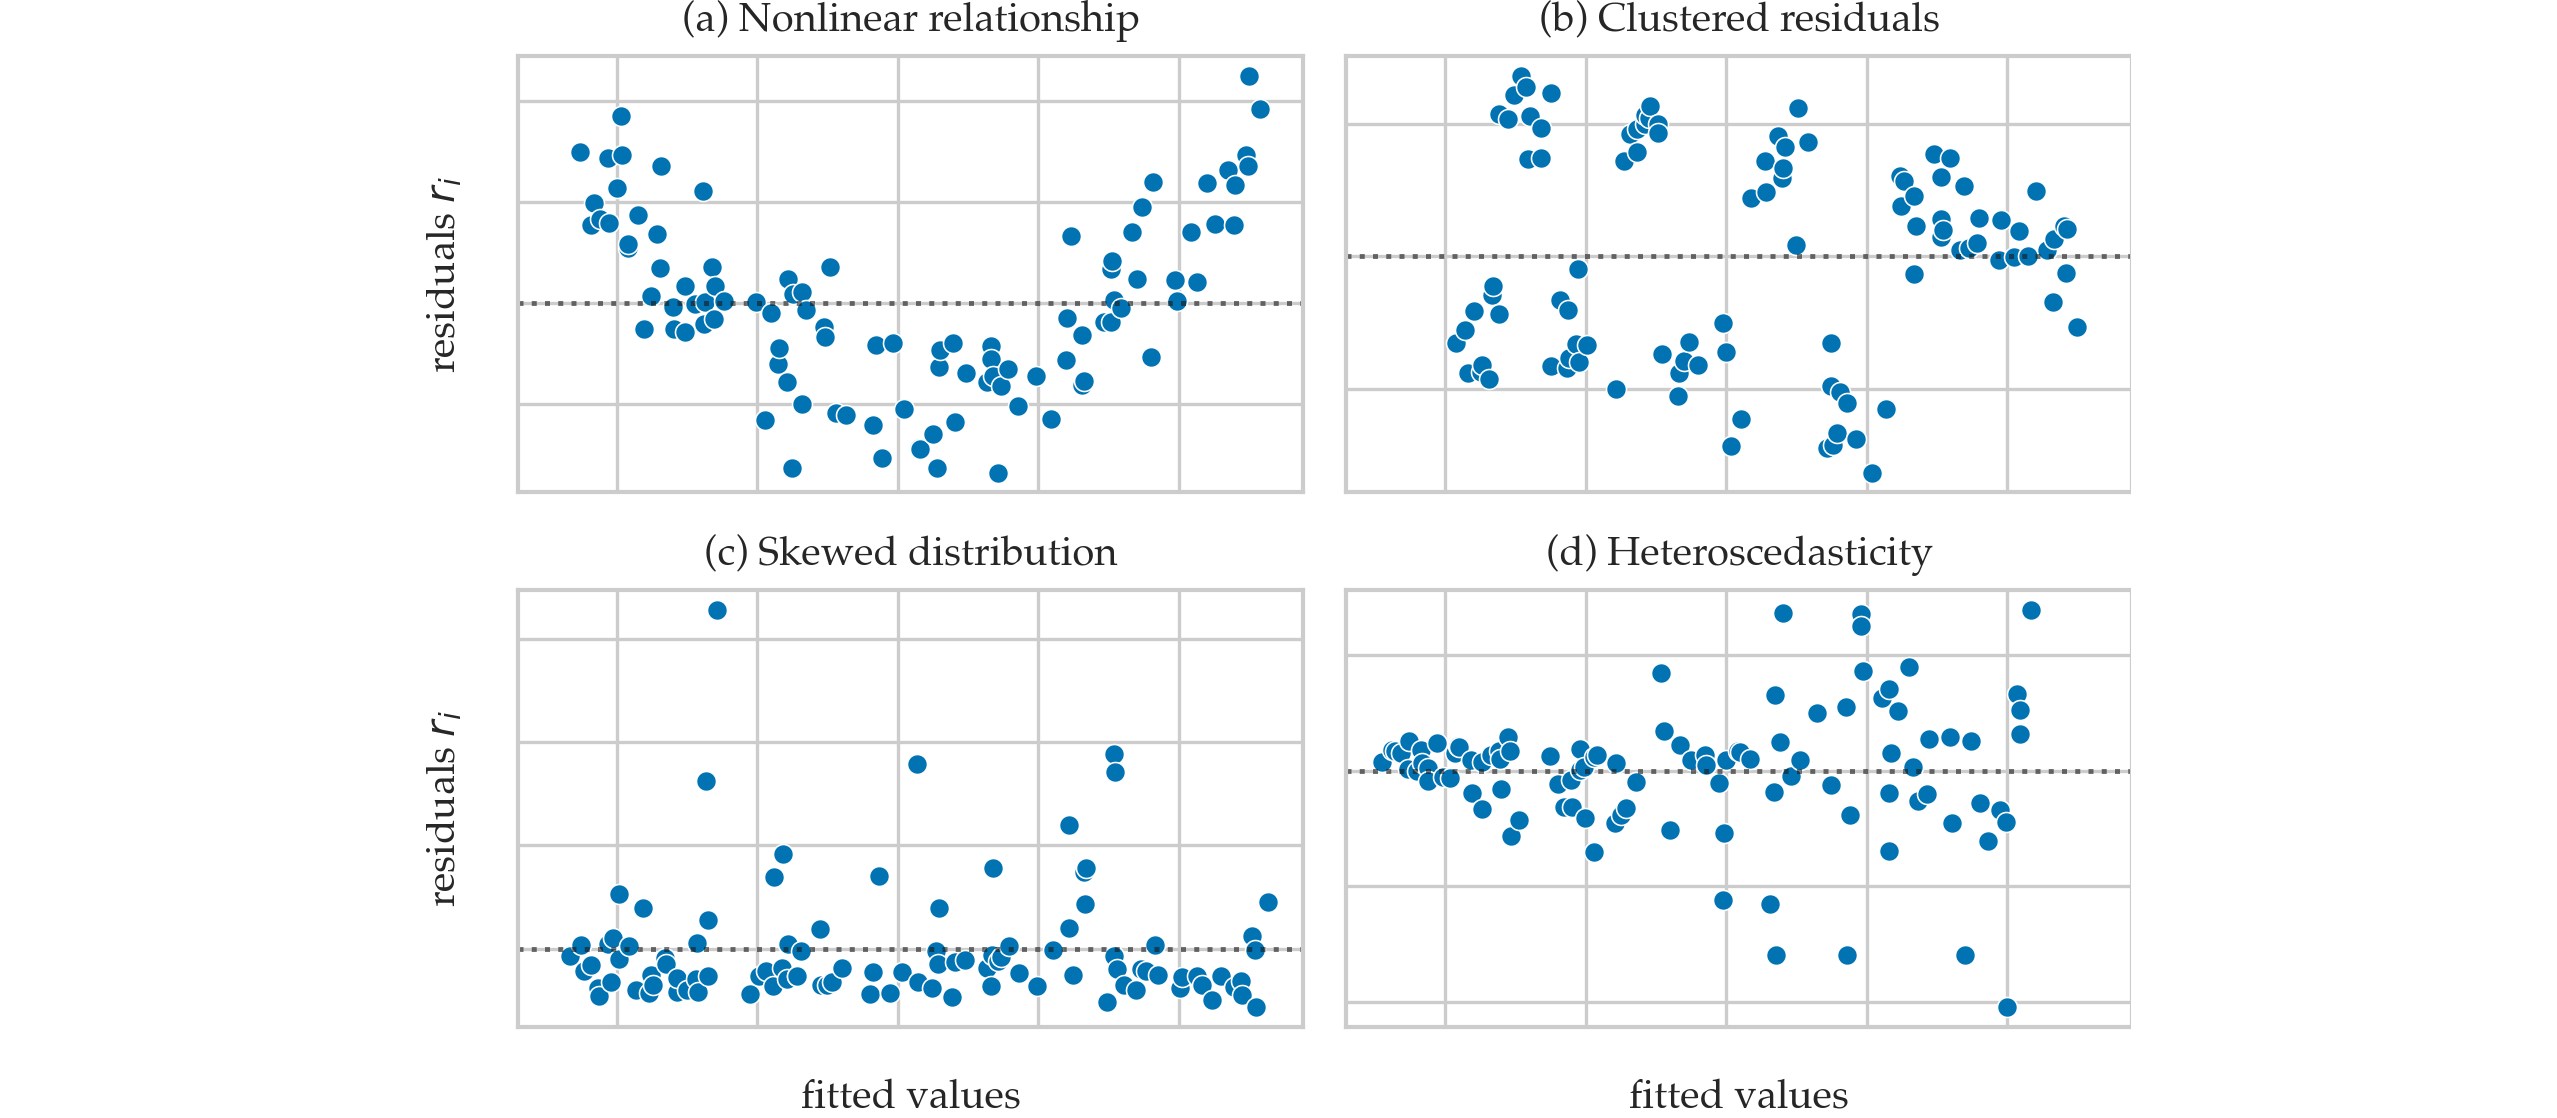
Residual plots that show violated assumptions
Sum of squares quantities
Sum of squared residuals
SSR = np.sum( residuals**2 )
SSR315.9122099692906Explained sum of squares
meanscore = scores.mean()
ESS = np.sum( (scorehats-meanscore)**2 )
ESS1078.2917900307098Total sum of squares
TSS = np.sum( (scores - meanscore)**2 )
TSS1394.2040000000002SSR + ESS # == TSS1394.2040000000004Coefficient of determination 
R2 = ESS / TSS
R20.7734103402591799Using linear models to make predictions
def predict(x, b0, b1):
    yhat = b0 + b1*x
    return yhat
Confidence interval for the mean
TODO: add formulas
Confidence interval for observations
TODO: add formulas
Example:predicting students’ scores
Predict the score of a new student who invests 9 hours of effort per week.
neweffort = 9
scorehat = predict(neweffort, b0=32.5, b1=4.5)
scorehat73.0Confidence interval for the mean score
#######################################################
newdev = (neweffort - efforts.mean())**2
sum_dev2 = np.sum((efforts - efforts.mean())**2)
se_meanscore = sigmahat * np.sqrt(1/n + newdev/sum_dev2)
se_meanscore1.2744485881877106from scipy.stats import t as tdist
alpha = 0.1
t_l, t_u = tdist(df=n-2).ppf([alpha/2, 1-alpha/2])
[scorehat + t_l*se_meanscore, scorehat + t_u*se_meanscore][70.74303643371006, 75.25696356628994]Prediction band for the mean score
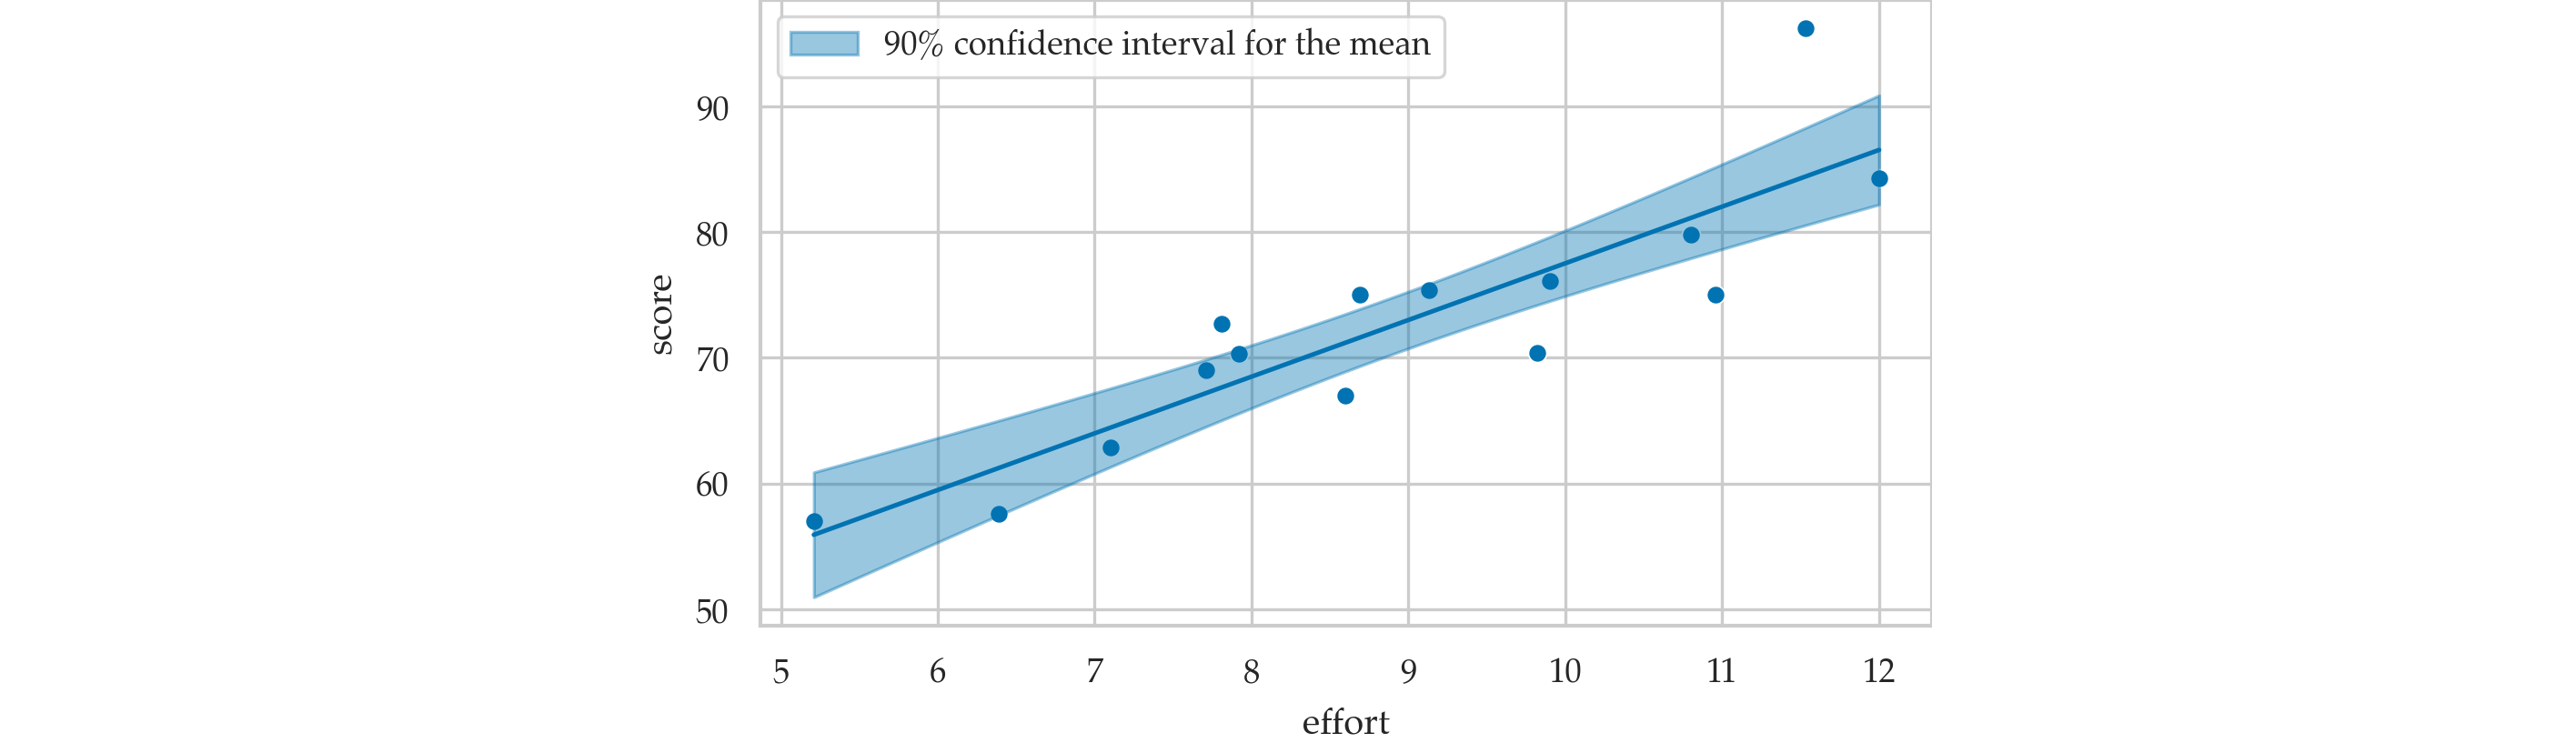
Confidence interval for predicted scores
se_score = sigmahat * np.sqrt(1 + 1/n + newdev/sum_dev2)
se_score5.0916754052414435alpha = 0.1
t_l, t_u = tdist(df=n-2).ppf([alpha/2, 1-alpha/2])
[scorehat + t_l*se_score, scorehat + t_u*se_score][63.982981983332934, 82.01701801666707]Prediction band for scores
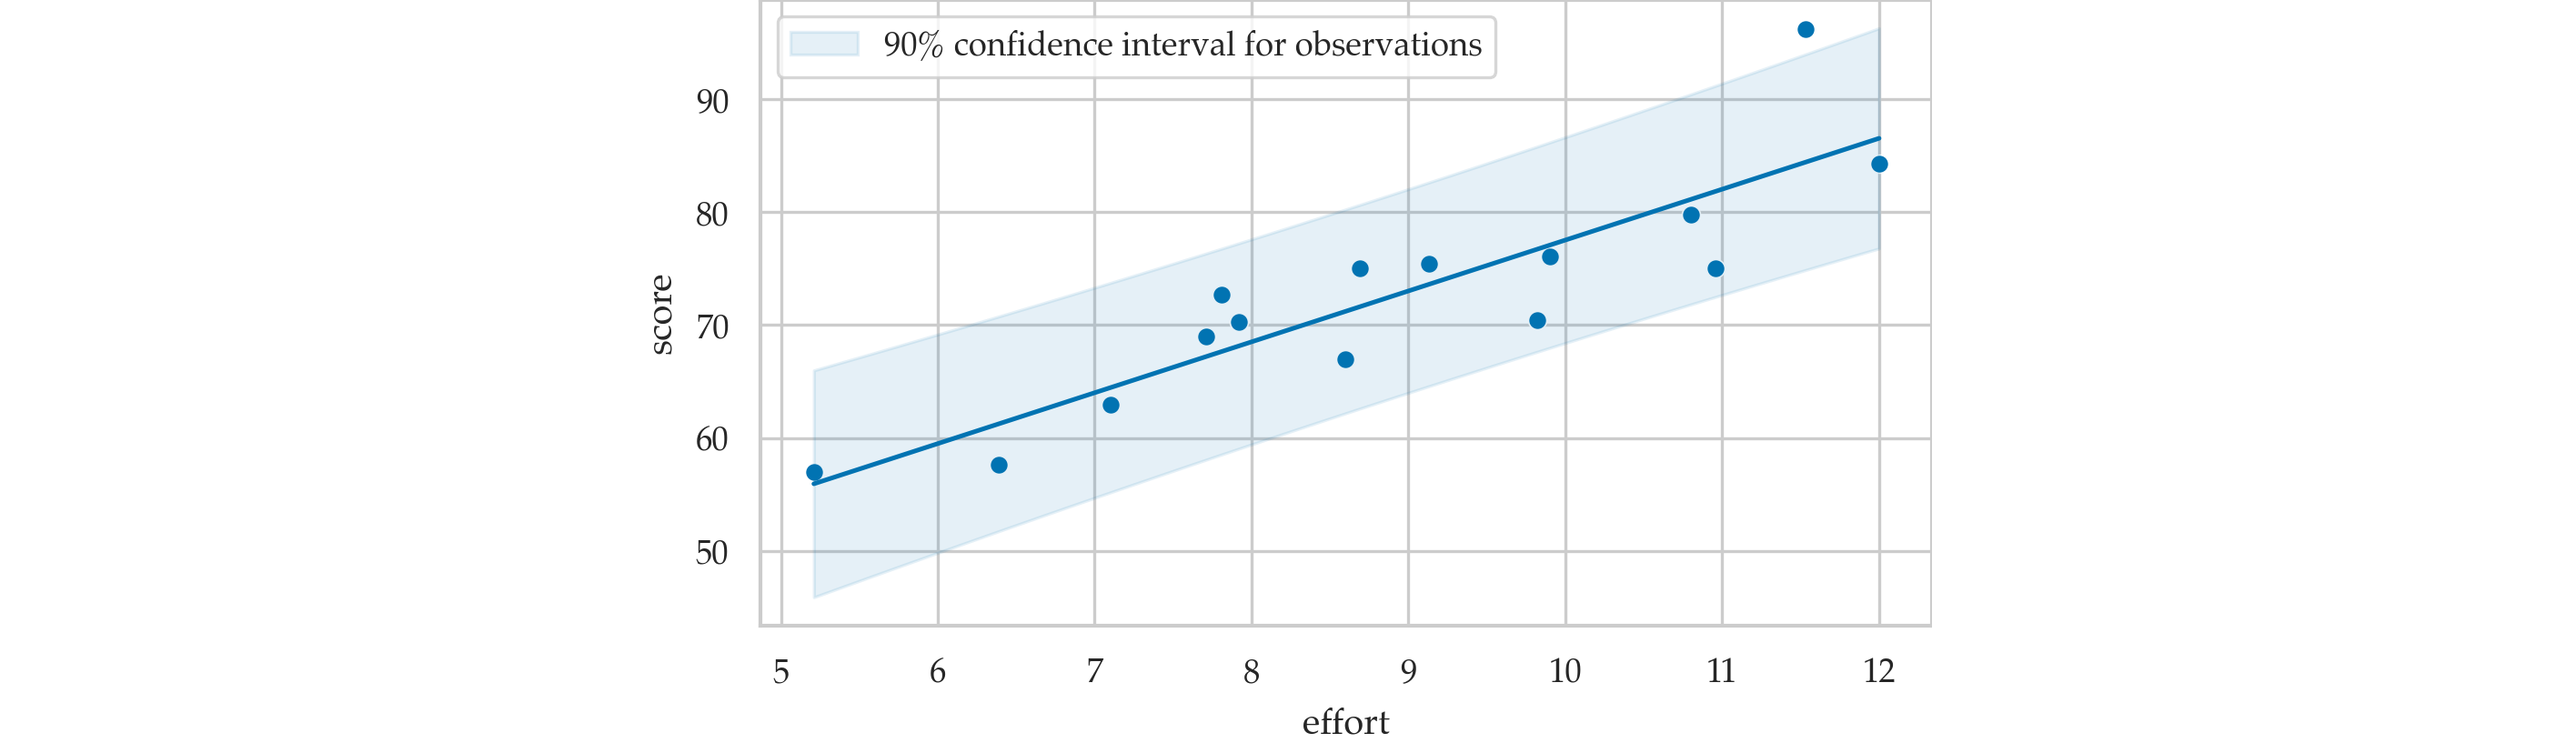
Prediction caveats
efforts.min(), efforts.max()(5.21, 12.0)It’s not OK to extrapolate the validity of the model outside of the range of values where we have observed data.
For example, there is no reason to believe in the model’s predictions about an effort of 20 hours per week:
predict(20, b0=32.5, b1=4.5)122.5Indeed, the model predicts the grade will be above 100% which is impossible.
Explanations
Software for fitting linear models
scipystatsmodelsscikit-learn
Fitting linear models with statsmodels
import statsmodels.formula.api as smf

lm1 = smf.ols("score ~ 1 + effort", data=students).fit()type(lm1)statsmodels.regression.linear_model.RegressionResultsWrapperEstimated parameters for the model
lm1.paramsIntercept 32.465809
effort 4.504850
dtype: float64type(lm1.params)pandas.SeriesWe often want to extract the intercept and slope parameters for use in subsequent calculations.
b0 = lm1.params["Intercept"]  # = lm1.params[0]
b1 = lm1.params["effort"]     # = lm1.params[1]
b0, b1
(32.46580930159963, 4.504850344209071)The estimate is obtained by taking the square root of the .scale attribute.
sigmahat = np.sqrt(lm1.scale)
sigmahat4.929598282660258Model fitted values
lm1.fittedvalues # == scorehats0 81.838969
1 71.612959
2 71.207522
3 68.144224
4 77.063828
5 81.118193
6 67.648690
7 73.595093
8 55.936080
9 67.198205
10 76.703440
11 84.406734
12 64.450247
13 61.251803
14 86.524013
dtype: float64Residuals
lm1.resid # == scores - scorehats0 -6.838969
1 3.387041
2 -4.207522
3 2.155776
4 -0.963828
5 -1.318193
6 5.051310
7 1.804907
8 1.063920
9 1.801795
10 -6.303440
11 11.793266
12 -1.550247
13 -3.651803
14 -2.224013
dtype: float64Sum-of-squared quantities
# SSR     # ESS     # TSS              # R2
lm1.ssr,  lm1.ess,  lm1.centered_tss,  lm1.rsquared
(315.9122099692906, 1078.2917900307095, 1394.2040000000002, 0.7734103402591798)Predictions
Predict the score of a new student who invests 9 hours of effort per week.
lm1.predict({"effort":9})0 73.009462
dtype: float64pred = lm1.get_prediction({"effort":9})
pred.se_mean, pred.conf_int(alpha=0.1)(array([1.27444859]), array([[70.75249883, 75.26642597]]))pred<statsmodels.regression._prediction.PredictionResults at 0x1155ffda0>pred.se_obs, pred.conf_int(obs=True, alpha=0.1)(array([5.09167541]), array([[63.99244438, 82.02648042]]))Model summary table
lm1.summary()Helper functions for plotting linear model results
plot_reg(lm): generate a regression plot for the modellmplot_resid(lm): residuals plot for the modellmplot_pred_bands(lm, ...): plot confidence intervals modellm. Useci_mean=Trueto plot the predictions for the mean, orci_obs=Trueto plot the predictions of the observations variable.
Regression plot
from ministats import plot_reg

plot_reg(lm1);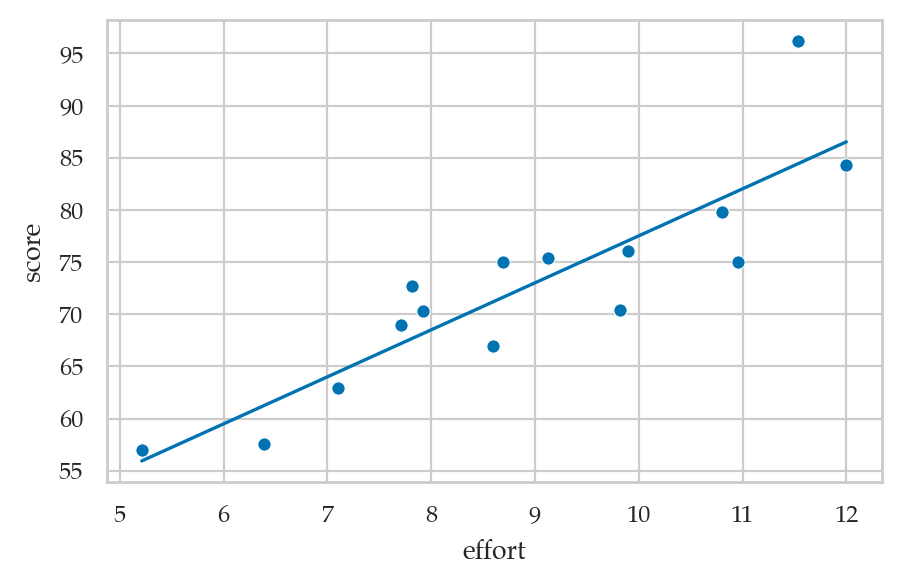
Residuals plot
xs = np.array([1,2,3])
hasattr(xs, "name")Falsexs = pd.Series([1,2,3])
hasattr(xs, "name") and xs.name is not NoneFalsefrom ministats import plot_resid
plot_resid(lm1);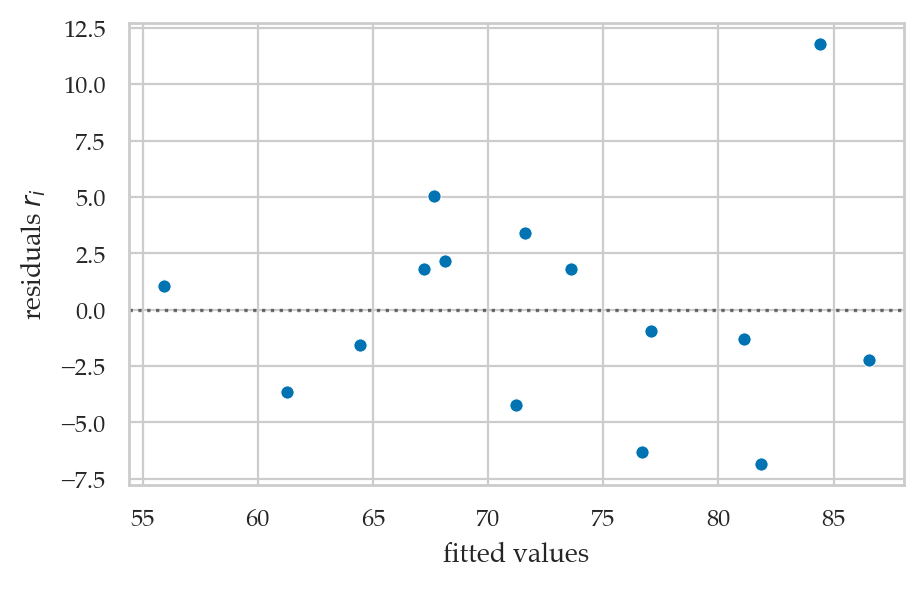
# BONUS plot residuals against predictor variable
plot_resid(lm1, pred="effort");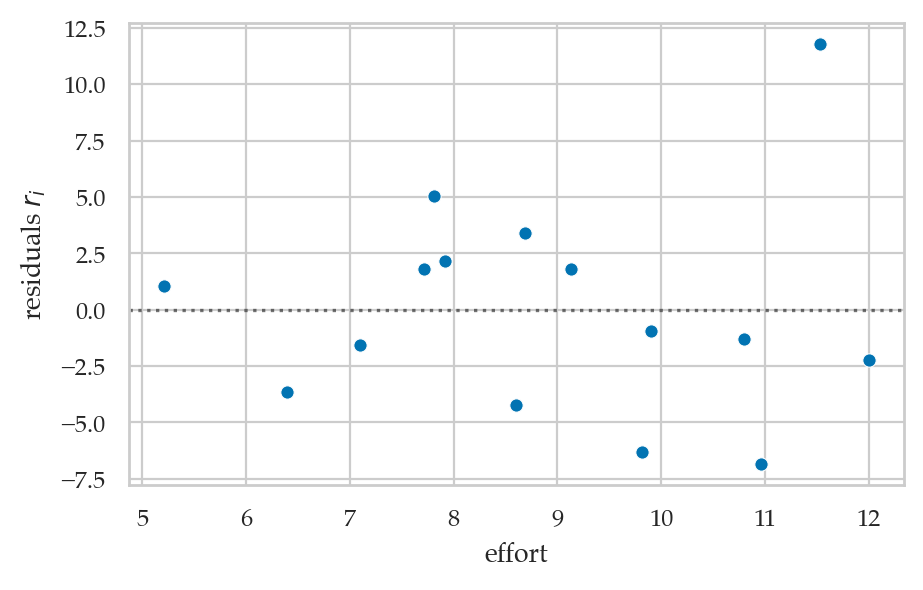
Prediction band plots
from ministats import plot_pred_bands

plot_reg(lm1)
plot_pred_bands(lm1, ci_mean=True, alpha_mean=0.1);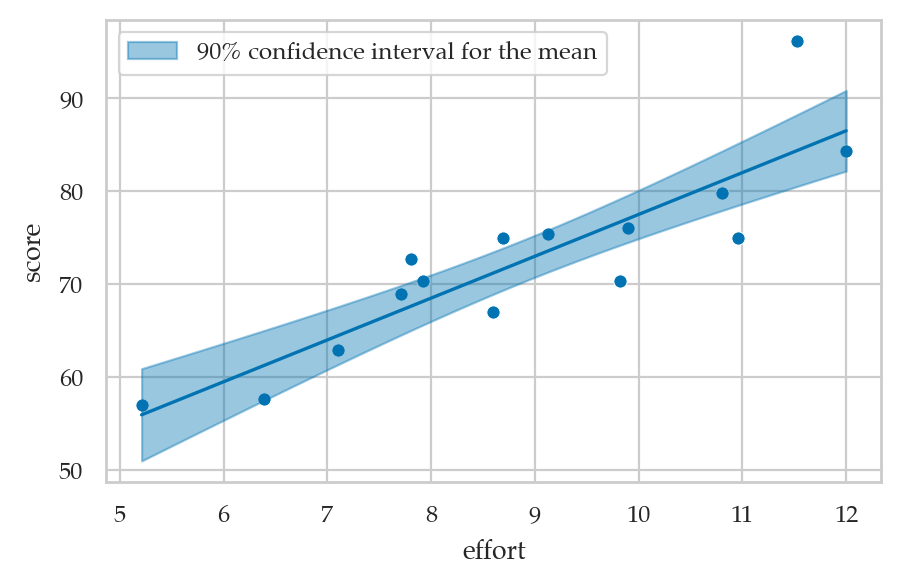
plot_reg(lm1)
plot_pred_bands(lm1, ci_obs=True, alpha_obs=0.1);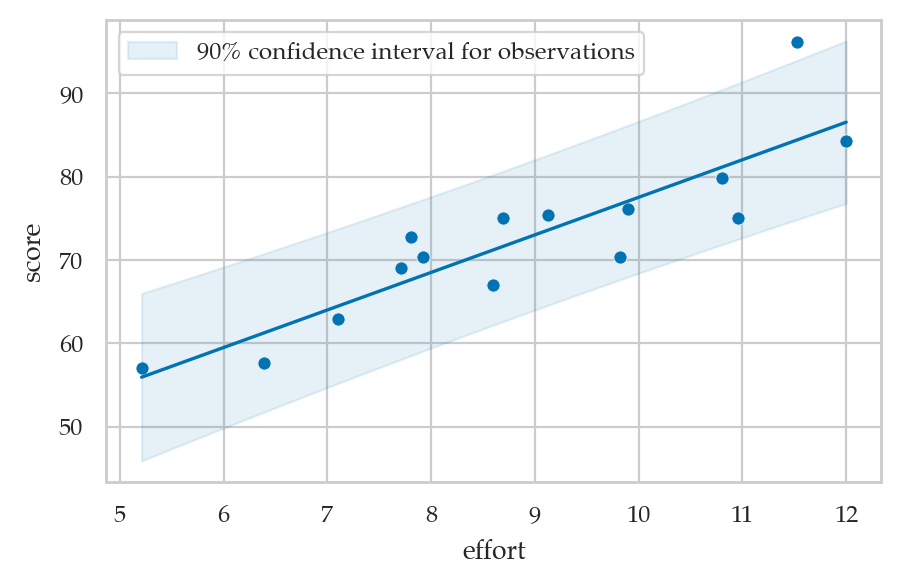
Seaborn functions for plotting linear models
Regression plot
sns.regplot(x="effort", y="score", ci=None, data=students);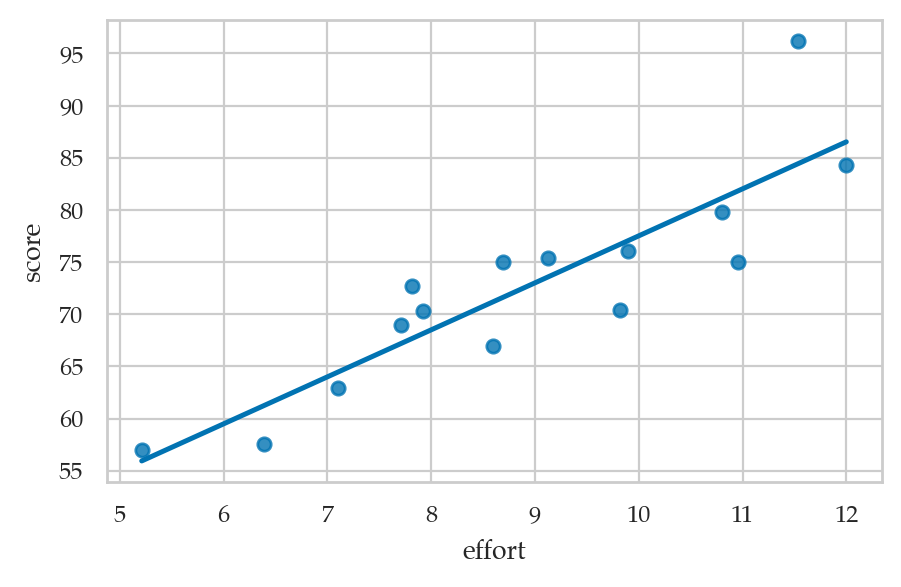
Residual plot
sns.residplot(x="effort", y="score", data=students);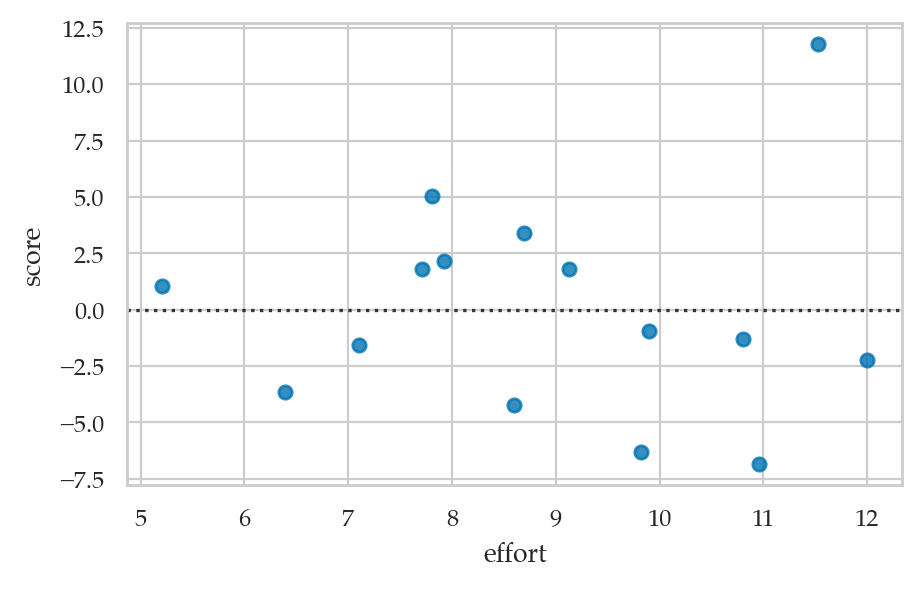
Pearson correlation coefficient revisited
Related to the Pearson correlation coefficient
efforts = students["effort"]
scores = students["score"]
pearson_r = efforts.corr(scores)
pearson_r0.8794375135614694# # ALT.
# from scipy.stats import pearsonr
# pearson_r = pearsonr(efforts, scores)[0]pearson_r**20.7734103402591797lm1 = smf.ols("score ~ 1 + effort", data=students).fit()
lm1.rsquared0.7734103402591798Alternative methods for fitting linear models (optional)
Numerical optimization
from scipy.optimize import minimize

def ssr(betas):
    scorehats = betas[0] + betas[1]*efforts
    resids = scores - scorehats
    return np.sum(resids**2)

b0, b1 = minimize(ssr, x0=[0,0]).x
b0, b1
(32.465809793102544, 4.504850301246796)Linear algebra
linear algebra solution using numpy
import numpy as np

# Prepare the design matrix
n = len(students)
X = np.ndarray((n,2))
X[:,0] = 1
X[:,1] = efforts
X
array([[ 1. , 10.96],
[ 1. , 8.69],
[ 1. , 8.6 ],
[ 1. , 7.92],
[ 1. , 9.9 ],
[ 1. , 10.8 ],
[ 1. , 7.81],
[ 1. , 9.13],
[ 1. , 5.21],
[ 1. , 7.71],
[ 1. , 9.82],
[ 1. , 11.53],
[ 1. , 7.1 ],
[ 1. , 6.39],
[ 1. , 12. ]])We obtain the least squares solution using the Moore–Penrose inverse formula:
lares = np.linalg.inv(X.T.dot(X)).dot(X.T).dot(scores)
b0, b1 = lares
b0, b1
(32.465809301599236, 4.504850344209086)Fitting linear models using scipy
The helper function scipy.stats.linregress ...
from scipy.stats import linregress

scipyres = linregress(efforts, scores)
scipyres.intercept, scipyres.slope
(32.465809301599634, 4.50485034420907)Fitting linear models using scikit-learn
The class sklearn.linear_model.LinearRegression allows us to fit linear models.
# %pip install scikit-learn# from sklearn.linear_model import LinearRegression
# sklmodel = LinearRegression()
# sklmodel.fit(efforts.values[:,np.newaxis], scores)
# sklmodel.intercept_, sklmodel.coef_
# (32.46580930159961, array([4.50485034]))Using the statsmodels low-level matrix API
import statsmodels.api as sm

X = sm.add_constant(efforts)
y = scores
smres = sm.OLS(y,X).fit()
smres.params["const"], smres.params["effort"]
(32.46580930159963, 4.504850344209071)Discussion
Maximum likelihood estimation
from scipy.optimize import minimize
from scipy.stats import norm

n = len(students)
efforts = students["effort"]
scores = students["score"]

def neg_log_likelihood(betas):
    scorehats = betas[0] + betas[1] * efforts
    residuals = scores - scorehats
    SSR = np.sum(residuals**2)
    sigmahat_MLE = np.sqrt(SSR/n)
    likelihoods = norm.pdf(residuals, scale=sigmahat_MLE)
    log_likelihood = np.sum(np.log(likelihoods))
    return -log_likelihood

b0, b1 = minimize(neg_log_likelihood, x0=[0,0]).x
b0, b1
(32.46581025941632, 4.504850229485637)# calculate the maximum log-likelihood achieved
-neg_log_likelihood([b0, b1])-44.139684178072535# the same quantity reported by the model `lm1`
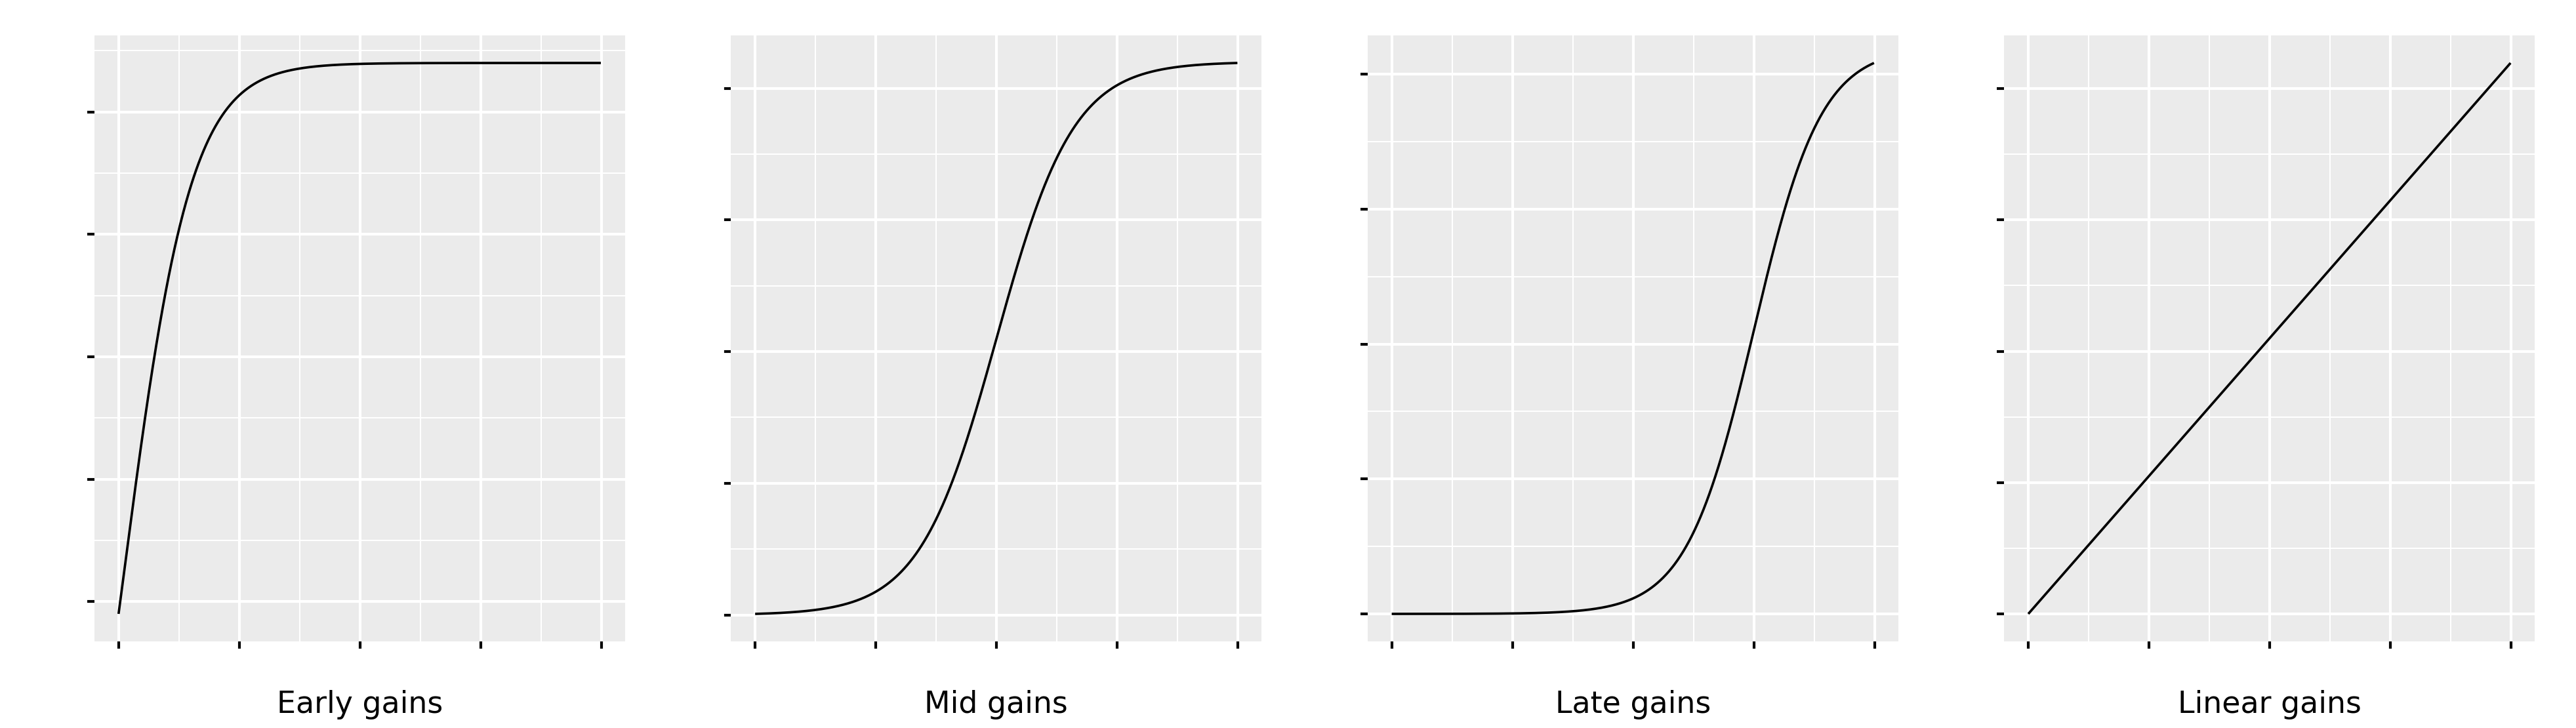
lm1.llf-44.139684178072514Examples of non-linear relationships
Hare are some examples of the different possible relationships between the effort and score variables.
Exercises
See the notebook exercises/sec41_simple_linear_regression.ipynb.
Links
(BONUS MATERIAL) Formula for standard error of coefficients
lm1.bseIntercept 6.155051
effort 0.676276
dtype: float64Formula using summations
TODO: show derivation why these formulas are equiv. to matrix formulas below when p=1
sum_dev2 = np.sum((efforts - efforts.mean())**2)
se_Intercept = sigmahat * np.sqrt(1/n + efforts.mean()**2/sum_dev2)
se_b_effort = sigmahat/np.sqrt(sum_dev2)
se_Intercept, se_b_effort
(6.155051380977695, 0.6762756464968055)# construct the design matrix for the model
X = sm.add_constant(students[["effort"]])
# calculate the diagonal of the inverse-covariance matrix
inv_covs = np.diag(np.linalg.inv(X.T.dot(X)))
np.sqrt(sigmahat**2 * inv_covs)array([6.15505138, 0.67627565])lm1.model.exog[:,1]array([10.96, 8.69, 8.6 , 7.92, 9.9 , 10.8 , 7.81, 9.13, 5.21,
7.71, 9.82, 11.53, 7.1 , 6.39, 12. ])