This notebook contains the code examples from Section 4.3 Interpreting linear models from the No Bullshit Guide to Statistics.
Notebook setup
# Ensure required Python modules are installed
%pip install --quiet numpy scipy seaborn pandas statsmodels ministats
[notice] A new release of pip is available: 26.0.1 -> 26.1.2
[notice] To update, run: /Users/ivan/Projects/Minireference/STATSbook/noBSstats/venv/bin/python3.12 -m pip install --upgrade pip
Note: you may need to restart the kernel to use updated packages.
# load Python modules
import os
import numpy as np
import pandas as pd
import seaborn as sns
import matplotlib.pyplot as plt
import statsmodels.formula.api as smf
import statsmodels.api as sm
import statsmodels.stats.api as sms# Figures setup
plt.clf() # needed otherwise `sns.set_theme` doesn't work
sns.set_theme(
context="paper",
style="whitegrid",
palette="colorblind",
rc={"font.family": "serif",
"font.serif": ["Palatino", "DejaVu Serif", "serif"],
"figure.figsize": (5, 3)},
)
%config InlineBackend.figure_format = "retina"<Figure size 640x480 with 0 Axes># Simple float __repr__
if int(np.__version__.split(".")[0]) >= 2:
np.set_printoptions(legacy='1.25')
# set random seed for repeatability
np.random.seed(42)# Download datasets/ directory if necessary
from ministats import ensure_datasets
ensure_datasets()datasets/ directory already exists.
Introduction
# load the dataset
doctors = pd.read_csv("datasets/doctors.csv")
n = doctors.shape[0]

# fit the model
formula = "score ~ 1 + alc + weed + exrc"
lm2 = smf.ols(formula, data=doctors).fit()

# model degrees of freedom (number of predictors)
p = lm2.df_model

# display the summary table
lm2.summary()Model fit metrics
Coefficient of determination
lm2.rsquared0.8421649167873537# ALT.
1 - lm2.ssr/lm2.centered_tss0.8421649167873537Adjusted coefficient of determination
lm2.rsquared_adj0.8390497506713147# ALT.
1 - (lm2.ssr/(n-p-1)) / (lm2.centered_tss/(n-1))0.8390497506713147F-statistic and associated p-value
lm2.fvalue, lm2.f_pvalue(270.34350189265837, 1.0512133413866784e-60)Log-likelihood
lm2.llf-547.6259042117637# ALT.
from scipy.stats import norm
sigmahat = np.sqrt(lm2.scale)
np.sum(np.log(norm.pdf(lm2.resid,scale=sigmahat)))
# Q: Why not exactly the same as lm2.llf?-547.651992151218# How lm2.llf is computed:
SSR = np.sum(lm2.resid**2)
nobs2 = n/2.0
llf = -np.log(SSR)*nobs2 # concentrated likelihood
llf -= ( 1+np.log(np.pi/nobs2) )*nobs2 # with likelihood constant
llf-547.6259042117637Information criteria
lm2.aic, lm2.bic(1103.2518084235273, 1115.4512324525256)# ALT.
2*(p+1) - 2*lm2.llf, np.log(n)*(p+1) - 2*lm2.llf(1103.2518084235273, 1115.4512324525256)Other model-fit metrics
The mean squared error (MSE)
from statsmodels.tools.eval_measures import mse

scores = doctors["score"]
scorehats = lm2.fittedvalues
mse(scores,scorehats), lm2.ssr/n
(65.56013803717556, 65.56013803717558)Parameter estimates
# estimated parameters
lm2.params
Intercept 60.452901
alc -1.800101
weed -1.021552
exrc 1.768289
dtype: float64# estimated sigma (std. of error term)
sigmahat = np.sqrt(lm2.scale)
sigmahat8.202768119825622# ALT.
np.sqrt(lm2.ssr/(n-p-1))8.202768119825622Confidence intervals for model parameters
# standard errors
lm2.bse
Intercept 1.289380
alc 0.069973
weed 0.476166
exrc 0.138056
dtype: float64lm2.conf_int(alpha=0.05)Hypothesis testing for linear models
T-tests for individual parameters
Hypothesis testing for slope coefficient
Is there a non-zero slope coefficient?
Example: t-test for the variable weed
Null hypothesis :
weedhas no effect onscore, which is equivalent to :Alternative hypothesis :
weedhas an effect onscore, and the slope is not zero, :
lm2.tvalues["weed"], lm2.pvalues["weed"], n-p-1(-2.1453705454368612, 0.033511561813423206, 152.0)Calculate the statistic:
obst_weed = (lm2.params["weed"] - 0) / lm2.bse["weed"]
obst_weed # = lm2.tvalues["weed"]-2.1453705454368612Calculate the associated -value
from scipy.stats import t as tdist

pleft = tdist(df=n-p-1).cdf(obst_weed)
pright = 1 - tdist(df=lm2.df_resid).cdf(obst_weed)
pvalue_weed = 2 * min(pleft, pright)
pvalue_weed # = lm2.pvalues["weed"]0.033511561813423206lm2.tvaluesIntercept 46.885245
alc -25.725654
weed -2.145371
exrc 12.808529
dtype: float64lm2.df_resid, n-p-1(152.0, 152.0)lm2.pvaluesIntercept 2.756807e-92
alc 2.985013e-57
weed 3.351156e-02
exrc 6.136296e-26
dtype: float64F-test for the overall model
lm2.fvalue270.34350189265837# ALT.
F = lm2.mse_model / lm2.mse_resid
F270.34350189265837lm2.f_pvalue1.0512133413866784e-60# ALT.
from scipy.stats import f as fdist
fdist(dfn=p, dfd=n-p-1).sf(F)1.0512133413866784e-60F-test for a submodel
formula2nw = "score ~ 1 + alc + exrc"
lm2_noweed = smf.ols(formula2nw, data=doctors).fit()
F_noweed, p_noweed, _ = lm2.compare_f_test(lm2_noweed)
F_noweed, p_noweed
(4.602614777228013, 0.03351156181342401)The F-statistic is the same as the t-statistic
F_noweed, obst_weed**2, lm2.tvalues["weed"]**2(4.602614777228013, 4.602614777228055, 4.602614777228055)p_noweed, pvalue_weed, lm2.pvalues["weed"](0.03351156181342401, 0.033511561813423206, 0.033511561813423206)Assumptions checks and diagnostics
Are the assumptions for the linear model satisfied?
Residuals plots
from ministats import plot_resid
plot_resid(lm2, lowess=True);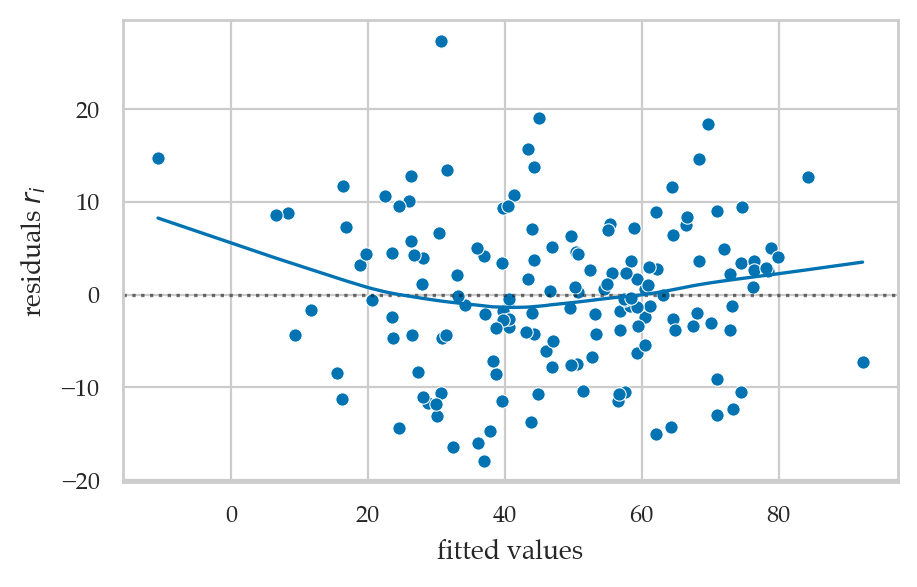
from ministats import plot_resid
plot_resid(lm2, pred="alc", lowess=True);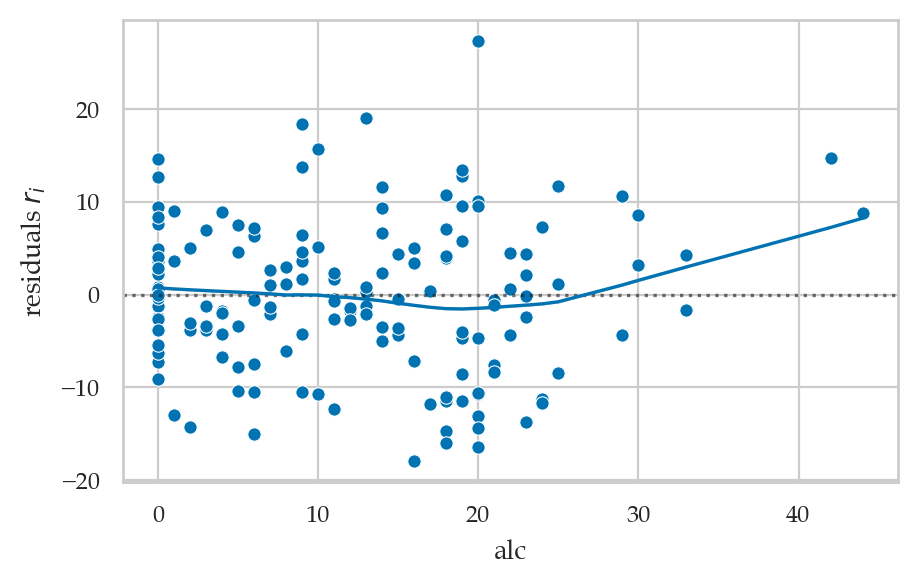
Linearity checks
Look at residuals plots.
Independence checks
Look at residuals plots.
Normality checks
Look at residuals plots...
QQ plot inspection
from statsmodels.graphics.api import qqplot
qqplot(lm2.resid, line="q");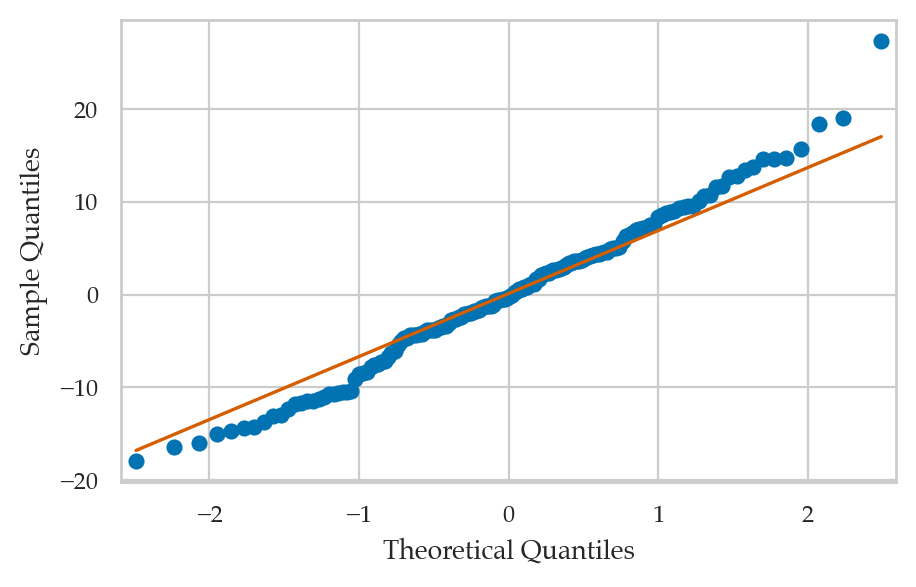
# BONUS
ax = sns.histplot(lm2.resid)
ax.set_xlim([-27,27]);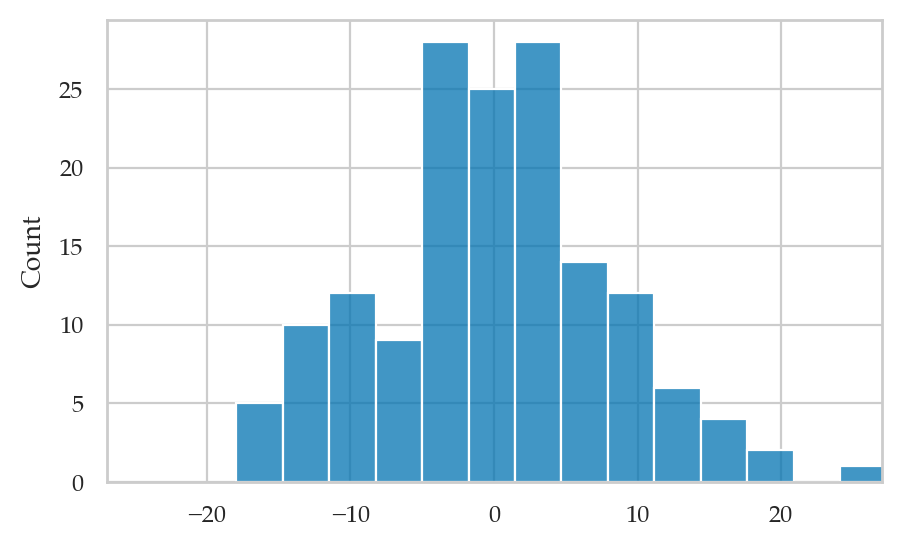
Skew and kurtosis
from scipy.stats import skew
from scipy.stats import kurtosis

skew(lm2.resid), kurtosis(lm2.resid, fisher=False)
(0.18224568453683543, 3.074795238556266)Homoscedasticity checks
The scale-location plot allows us to see if pattern in the variance of the residuals exists.
from ministats import plot_scaleloc

plot_scaleloc(lm2);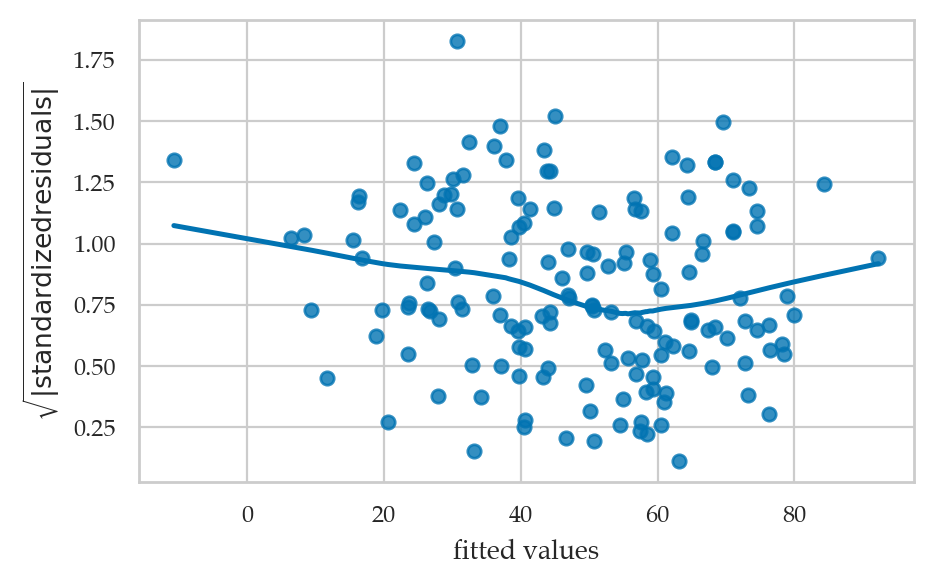
# ALT. Generate the scale-location plot from scratch

# 1. Compute the square root of the standardized residuals
scorehats = lm2.fittedvalues
std_resids = lm2.resid / np.sqrt(lm2.scale)
sqrt_std_resids = np.sqrt(np.abs(std_resids))

# 2. Generate the scatter plot
ax = sns.scatterplot(x=scorehats, y=sqrt_std_resids)

# 3. Add the LOWESS curve
from statsmodels.nonparametric.smoothers_lowess import lowess
xgrid, ylowess = lowess(sqrt_std_resids, scorehats).T
sns.lineplot(x=xgrid, y=ylowess, ax=ax)

# 4. Add descriptive labels
ax.set_ylabel(r"$\sqrt{|standardized\ residuals|}$")
ax.set_xlabel("fitted values");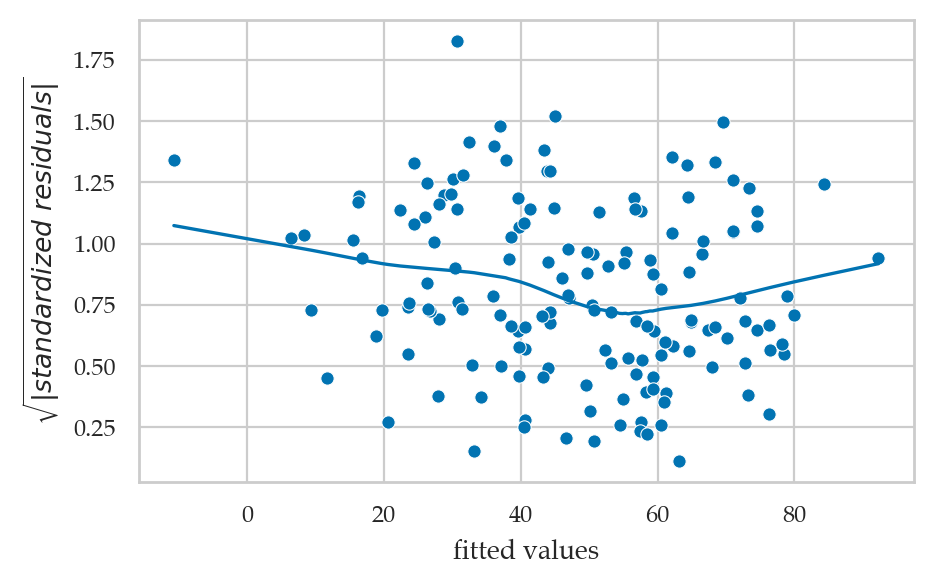
Collinearity checks
Check the correlation matrix
corrM = doctors[["alc", "weed", "exrc"]].corr()
corrM.round(4)# # BONUS 1 (not covered anywhere earlier in the book)
# sns.heatmap(corrM, annot=True, fmt='.2f', cmap="Grays");# # BONUS 2 (not covered anywhere earlier in the book)
# sns.pairplot(doctors[["alc", "weed", "exrc"]]);Condition number
lm2.condition_number31.229721453770157# ALT. (compute from scratch)
#######################################################
X = sm.add_constant(doctors[["alc","weed","exrc"]])
eigvals = np.linalg.eigvals(X.T @ X)
lam_max, lam_min = np.max(eigvals), np.min(eigvals)
np.sqrt(lam_max/lam_min)31.22972145377028Variance inflation factor
from ministats import calc_lm_vif

calc_lm_vif(lm2, "alc"), calc_lm_vif(lm2, "weed"), calc_lm_vif(lm2, "exrc")
(1.002669215630476, 1.0107031450073227, 1.010048809433661)# ALT. using variance_inflation_factor from statsmodels
from statsmodels.stats.outliers_influence \
import variance_inflation_factor as statsmodels_vif
X = sm.add_constant(doctors[["alc","weed","exrc"]])
statsmodels_vif(X, 1) # variation inflation factor of "alc" in lm21.002669215630476Perfect multicollinearity example
doctorscol = doctors.copy()
doctorscol["alc2"] = doctors["alc"]
formula2col = "score ~ 1 + alc + alc2 + weed + exrc"
lm2col = smf.ols(formula2col, data=doctorscol).fit()
lm2col.params
Intercept 60.452901
alc -0.900051
alc2 -0.900051
weed -1.021552
exrc 1.768289
dtype: float64calc_lm_vif(lm2col, "alc")/Users/ivan/Projects/Minireference/software/ministats/ministats/linear_models.py:17: RuntimeWarning: divide by zero encountered in scalar divide
vif = 1. / (1. - r_squared_i)
inf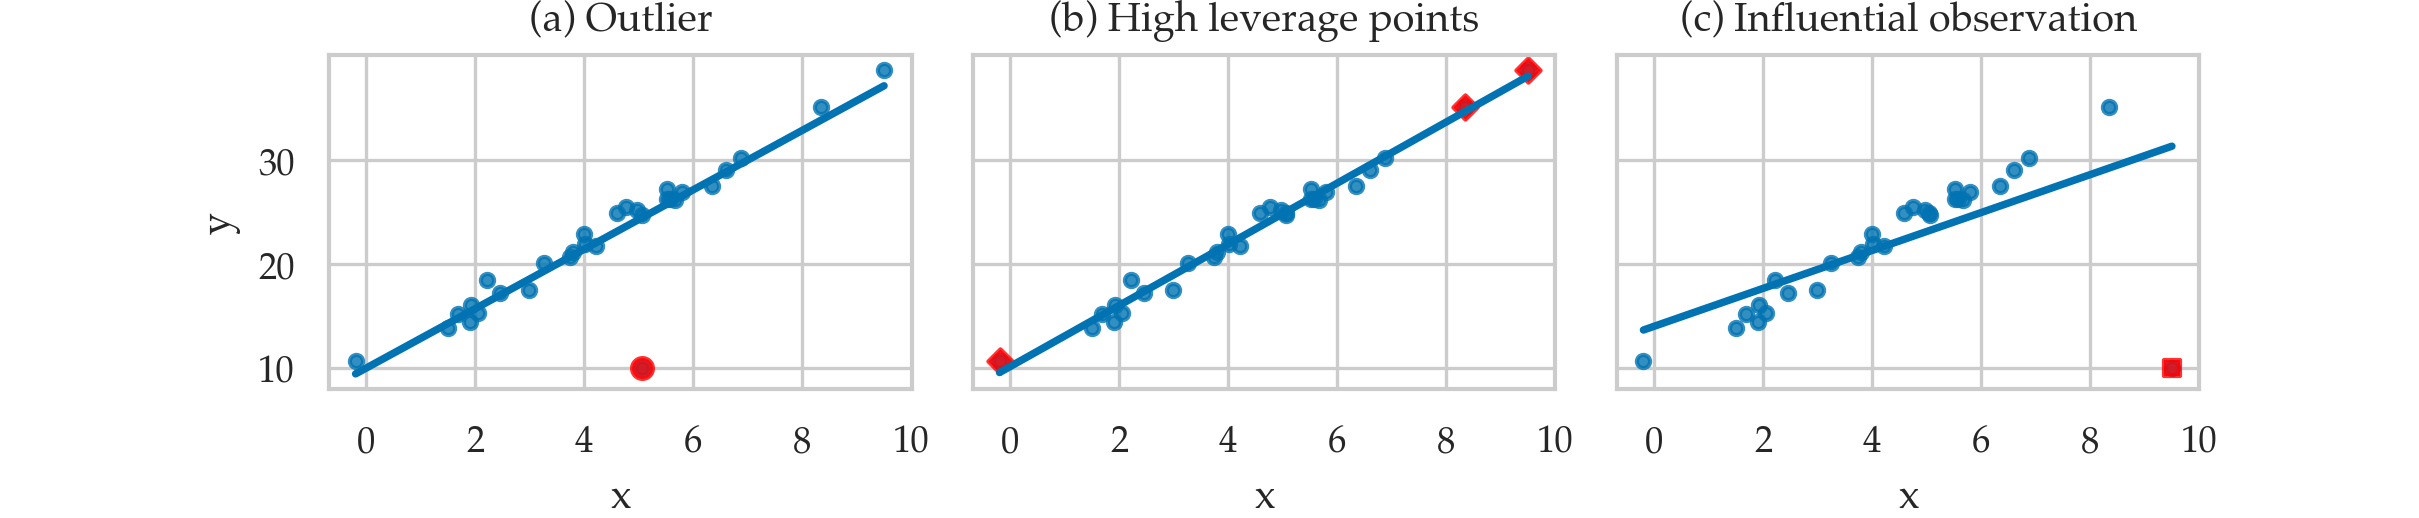
Leverage and influence metrics
TODO: add definitions of quantities in point form
Leverage plots
from statsmodels.graphics.api import plot_leverage_resid2

plot_leverage_resid2(lm2);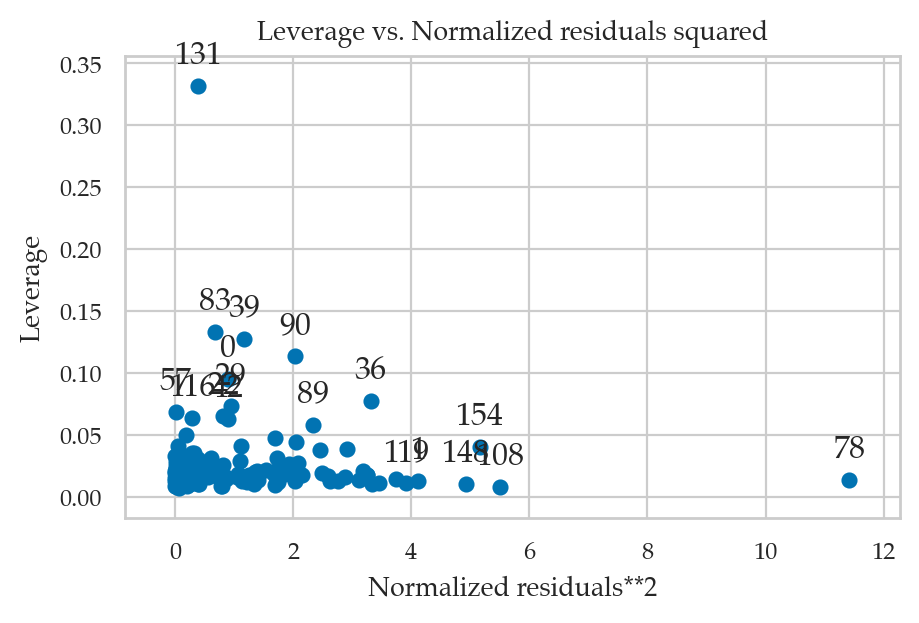
Influence plots
from statsmodels.graphics.api import influence_plot

influence_plot(lm2, criterion="cooks", size=4);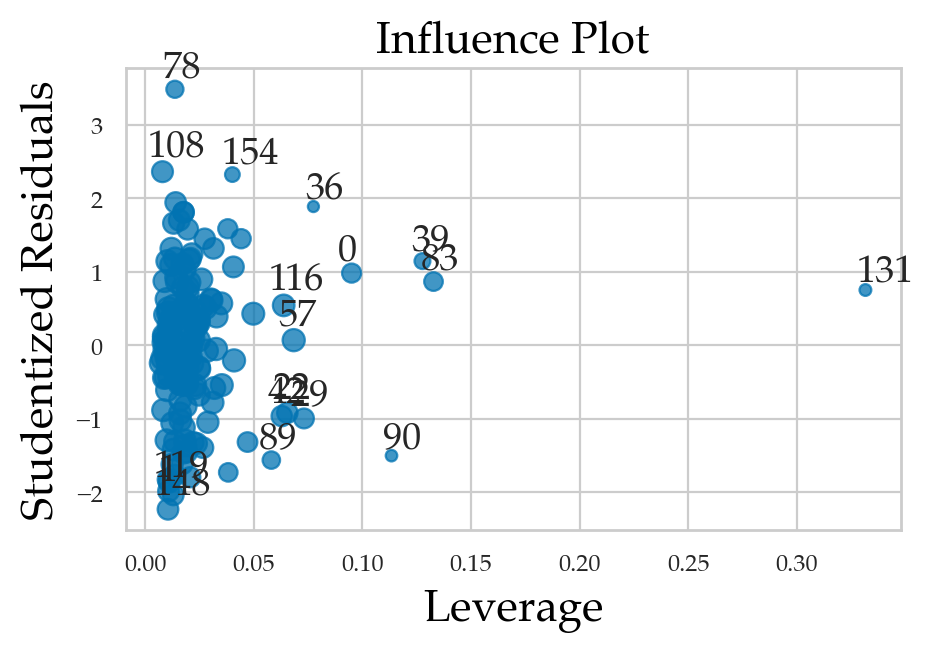
Model predictions
Prediction on the dataset
lm2.fittedvalues0 55.345142
1 32.408174
2 71.030821
3 56.789073
4 57.514154
...
151 58.867105
152 43.049719
153 57.728460
154 69.617361
155 78.135788
Length: 156, dtype: float64Prediction for new data
newdoc = {"alc":3, "weed":1, "exrc":8}
lm2.predict(newdoc)
0 68.177355
dtype: float64newdoc_score_pred = lm2.get_prediction(newdoc)
newdoc_score_pred.conf_int(obs=True, alpha=0.1)array([[54.50324518, 81.85146489]])In-sample prediction accuracy
# Compute the in-sample mean squared error (MSE)
scores = doctors['score']
scorehats = lm2.fittedvalues
mse = np.mean( (scores - scorehats)**2 )
mse65.56013803717556# ALT.
lm2.ssr/n65.56013803717558# # ALT2.
# from statsmodels.tools.eval_measures import mse
# mse(scores,scorehats)Out-of-sample prediction accuracy
TODO: explain
Leave-one-out cross-validation
loo_preds = np.zeros(n)
for i in range(n):
    doctors_no_i = doctors.drop(index=i)
    lm2_no_i = smf.ols(formula,data=doctors_no_i).fit()
    predictors_i = dict(doctors.loc[i,:])
    pred_i = lm2_no_i.predict(predictors_i)[0]
    loo_preds[i] = pred_i

# Calculate the out-of-sample mean squared error
mse_loo = np.mean( (doctors['score'] - loo_preds)**2 )
mse_loo69.20054514710952Compare with the in-sample MSE of the model which is lower.
lm2.ssr/n65.56013803717558Towards machine learning
The out-of-sample prediction accuracy is a common metric used in machine learning (ML) tasks.
Explanations
Adjusted 
TODO: show formula
# TODO Calculating standard error of parameters (optional)
lm2.bseIntercept 1.289380
alc 0.069973
weed 0.476166
exrc 0.138056
dtype: float64# construct the design matrix for the model
X = sm.add_constant(doctors[["alc","weed","exrc"]])
# calculate the diagonal of the inverse-covariance matrix
inv_covs = np.diag(np.linalg.inv(X.T.dot(X)))
sigmahat*np.sqrt(inv_covs)array([1.28938008, 0.06997301, 0.4761656 , 0.13805557])# these lead to approx. same result because predictors are not correlated
# but the correct formula is to use the inv. covariance matrix as above.
sum_alc_dev2 = np.sum((doctors["alc"] - doctors["alc"].mean())**2)
sum_weed_dev2 = np.sum((doctors["weed"] - doctors["weed"].mean())**2)
sum_exrc_dev2 = np.sum((doctors["exrc"] - doctors["exrc"].mean())**2)
se_b_alc = sigmahat / np.sqrt(sum_alc_dev2)
se_b_weed = sigmahat / np.sqrt(sum_weed_dev2)
se_b_exrc = sigmahat / np.sqrt(sum_exrc_dev2)
se_b_alc, se_b_weed, se_b_exrc(0.06987980522527787, 0.4736376432238543, 0.13736710473639843)Metrics for influential observations
infl = lm2.get_influence()
infl.hat_matrix_diag[0:5]
array([0.09502413, 0.0129673 , 0.01709783, 0.01465484, 0.00981632])infl.resid_studentized_external[0:5]array([ 0.98085317, -2.03409243, -1.61072775, -0.21903275, -1.29094028])infl.cooks_distance[0][0:5]array([0.02526116, 0.01331454, 0.01116562, 0.00017951, 0.0041123 ])infl.dffits[0][0:5]array([ 0.31783554, -0.23314692, -0.21244055, -0.02671194, -0.12853536])Calculating leverage and influence metrics using statsmodels
infl = lm2.get_influence()
infl_df = infl.summary_frame()
# list(infl_df.columns)
cols = ["student_resid", "hat_diag", "cooks_d", "dffits"]
infl_df[cols].round(3).head(5)Hypothesis tests for checking linear model assumptions
lm2.diagn{'jb': 0.8999138579592698,
'jbpv': 0.6376556155083217,
'skew': 0.18224568453683543,
'kurtosis': 3.074795238556266,
'omni': 1.140399985281413,
'omnipv': 0.5654123490825875,
'condno': 31.229721453770157,
'mineigval': 40.14996367643264}Hypothesis test for linearity
sms.linear_harvey_collier(lm2)TtestResult(statistic=1.4317316989777142, pvalue=0.15427366179829277, df=152)Normality tests
from statsmodels.stats.stattools import omni_normtest

omni, omnipv = omni_normtest(lm2.resid)
omni, omnipv
(1.140399985281413, 0.5654123490825875)from statsmodels.stats.stattools import jarque_bera
jb, jbpv, skew, kurtosis = jarque_bera(lm2.resid)
jb, jbpv, skew, kurtosis(0.8999138579592698,
0.6376556155083217,
0.18224568453683543,
3.074795238556266)Independence test (autocorrelation)
from statsmodels.stats.stattools import durbin_watson

durbin_watson(lm2.resid)1.8284830211766738lm, p_lm, _, _ = sms.het_breuschpagan(lm2.resid, lm2.model.exog)
lm, p_lm(6.254809752854332, 0.09985027888796476)Goldfeld-Quandt test
# sort by score
idxs = doctors.sort_values("alc").index

# sort by scorehats
idxs = np.argsort(lm2.fittedvalues)
X = lm2.model.exog[idxs,:]
resid = lm2.resid[idxs]

# run the test
F, p_F, _ = sms.het_goldfeldquandt(resid, X, idx=1)
F, p_F
(1.5346515257083706, 0.033694730002866664)Discussion
Maximum likelihood estimate
from scipy.optimize import minimize
from scipy.stats import norm

n = len(doctors)
preds = doctors[["alc", "weed", "exrc"]]
scores = doctors["score"]

def neg_log_likelihood(betas):
    scorehats = betas[0] + (betas[1:]*preds).sum(1)
    residuals = scores - scorehats
    SSR = np.sum(residuals**2)
    sigmahat_MLE = np.sqrt(SSR/n)
    likelihoods = norm.pdf(residuals, scale=sigmahat_MLE)
    log_likelihood = np.sum(np.log(likelihoods))
    return -log_likelihood

betas = minimize(neg_log_likelihood, x0=[0,0,0,0]).x
betasarray([60.45288852, -1.80010089, -1.0215511 , 1.76828937])# the results are the same as `lm2.params`
lm2.params.valuesarray([60.45290059, -1.80010132, -1.02155166, 1.76828876])# calculate the maximum log-likelihood achieved
-neg_log_likelihood(betas), lm2.llf/var/folders/yp/48zx9brn6mj6vmy50smb844w0000gn/T/ipykernel_57366/3097099034.py:9: Pandas4Warning: Starting with pandas version 4.0 all arguments of sum will be keyword-only.
scorehats = betas[0] + (betas[1:]*preds).sum(1)
(-547.6259042118089, -547.6259042117637)Regularization
doctors[["alc", "weed", "exrc"]].std()alc 9.428506
weed 1.391068
exrc 4.796361
dtype: float64# TRUE
# alc = - 1.8
# weed = - 0.5
# exrc = + 1.9
# FITTED
lm2.paramsIntercept 60.452901
alc -1.800101
weed -1.021552
exrc 1.768289
dtype: float64L1 regularization (LASSO)
Set alpha option to the desired value and L1_wt = 1,
which means L1 regularization.
lm2_L1reg = smf.ols(formula, data=doctors) \
               .fit_regularized(alpha=0.3, L1_wt=1.0)
lm2_L1reg.params
Intercept 58.930367
alc -1.763306
weed 0.000000
exrc 1.795228
dtype: float64L2 regularization (ridge)
Set alpha option to the desired value and L1_wt = 0,
which means L1 regularization and L2 regularization.
lm2_L2reg = smf.ols(formula, data=doctors) \
               .fit_regularized(alpha=0.05, L1_wt=0.0001)
lm2_L2reg.params
Intercept 50.694960
alc -1.472536
weed -0.457425
exrc 2.323386
dtype: float64Statsmodels diagnostics plots (BONUS TOPIC)
TODO: import explanations from .tex
Plot fit against one regressor
see https://
from statsmodels.graphics.api import plot_fit

with plt.rc_context({"figure.figsize":(9,2.6)}):
    fig, (ax1,ax2,ax3) = plt.subplots(1,3, sharey=True)
    plot_fit(lm2, "alc",  ax=ax1)
    plot_fit(lm2, "weed", ax=ax2)
    plot_fit(lm2, "exrc", ax=ax3)
    ax2.get_legend().remove()
    ax3.get_legend().remove()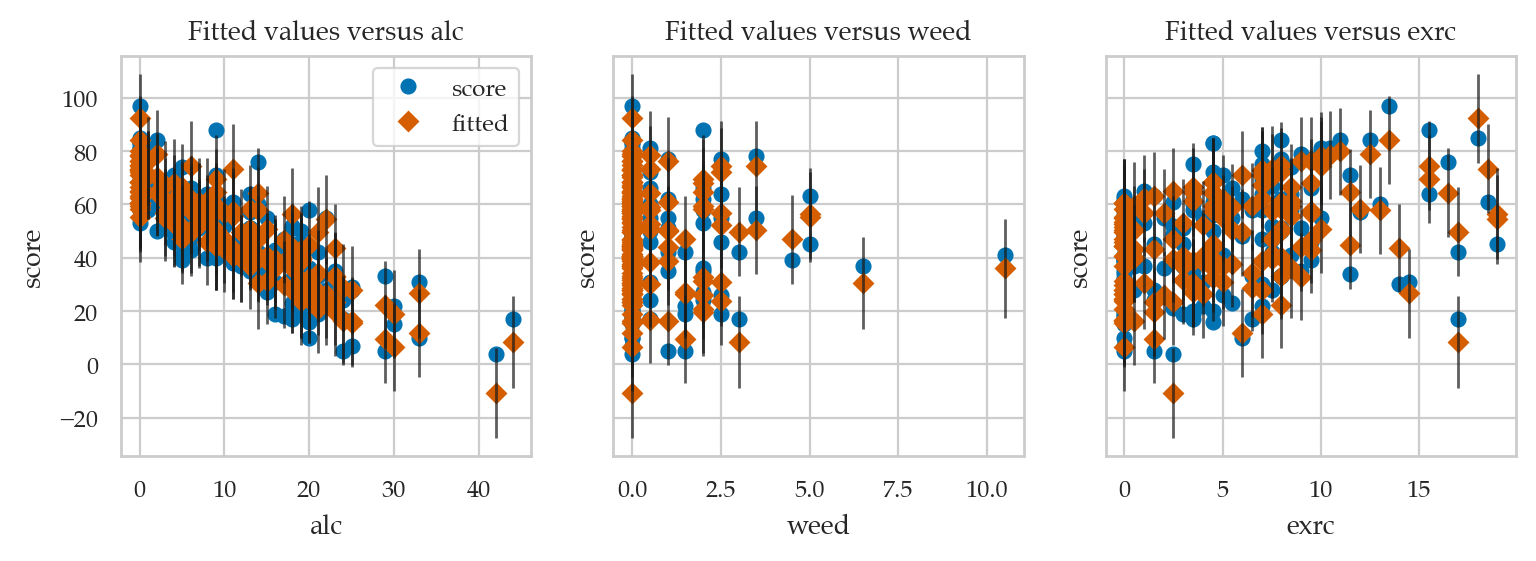
Partial regression plot
from statsmodels.graphics.api import plot_partregress

with plt.rc_context({"figure.figsize":(9,2.6)}):
    fig, (ax1,ax2,ax3) = plt.subplots(1,3, sharey=True)
    plot_partregress("score", "alc",  exog_others=[], data=doctors, obs_labels=False, ax=ax1)
    plot_partregress("score", "weed", exog_others=[], data=doctors, obs_labels=False, ax=ax2)
    plot_partregress("score", "exrc", exog_others=[], data=doctors, obs_labels=False, ax=ax3)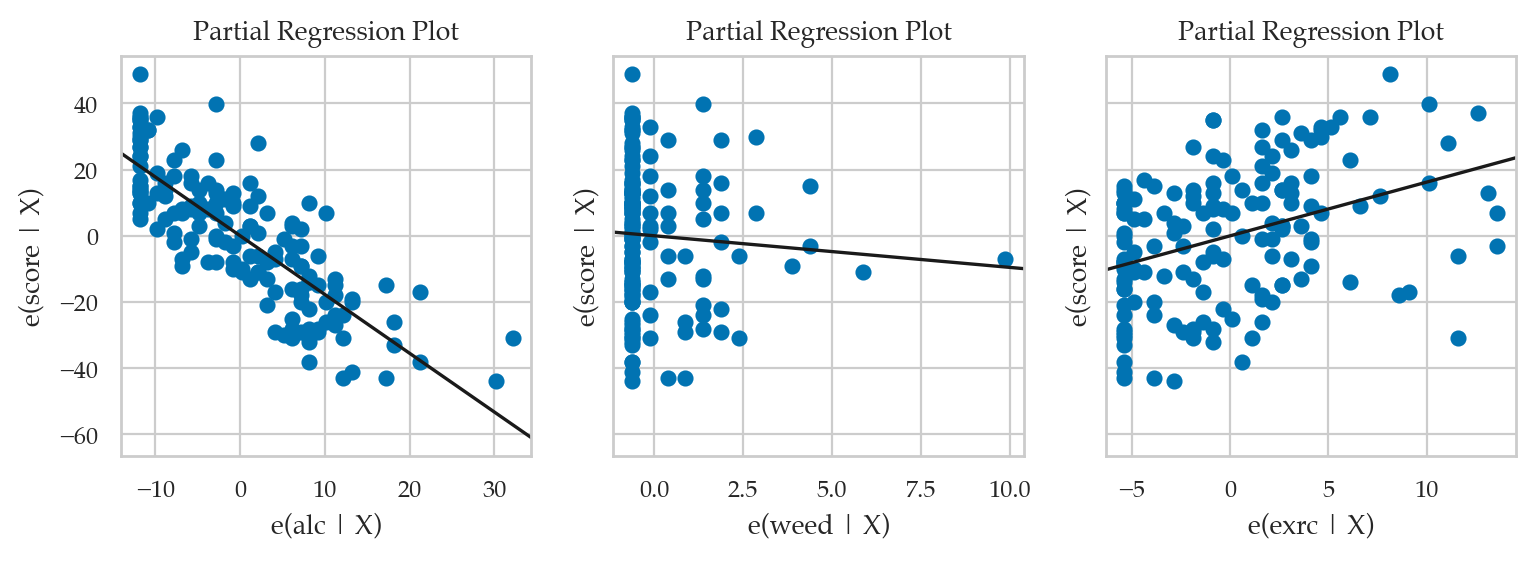
CCPR plot
component and component-plus-residual
see https://
from statsmodels.graphics.api import plot_ccpr

with plt.rc_context({"figure.figsize":(9,2.6)}):
    fig, (ax1,ax2,ax3) = plt.subplots(1,3)
    fig.subplots_adjust(wspace=0.5)

    plot_ccpr(lm2, "alc", ax=ax1)
    ax1.set_title("")
    ax1.set_ylabel(r"$\mathrm{alc} \cdot \widehat{\beta}_{\mathrm{alc}} \; + \; \mathbf{r}$")

    plot_ccpr(lm2, "weed", ax=ax2)
    ax2.set_title("")
    ax2.set_ylabel(r"$\mathrm{weed} \cdot \widehat{\beta}_{\mathrm{weed}} \; + \; \mathbf{r}$", labelpad=-3)

    plot_ccpr(lm2, "exrc", ax=ax3)
    ax3.set_title("")
    ax3.set_ylabel(r"$\mathrm{exrc} \cdot \widehat{\beta}_{\mathrm{exrc}} \; + \; \mathbf{r}$", labelpad=-3)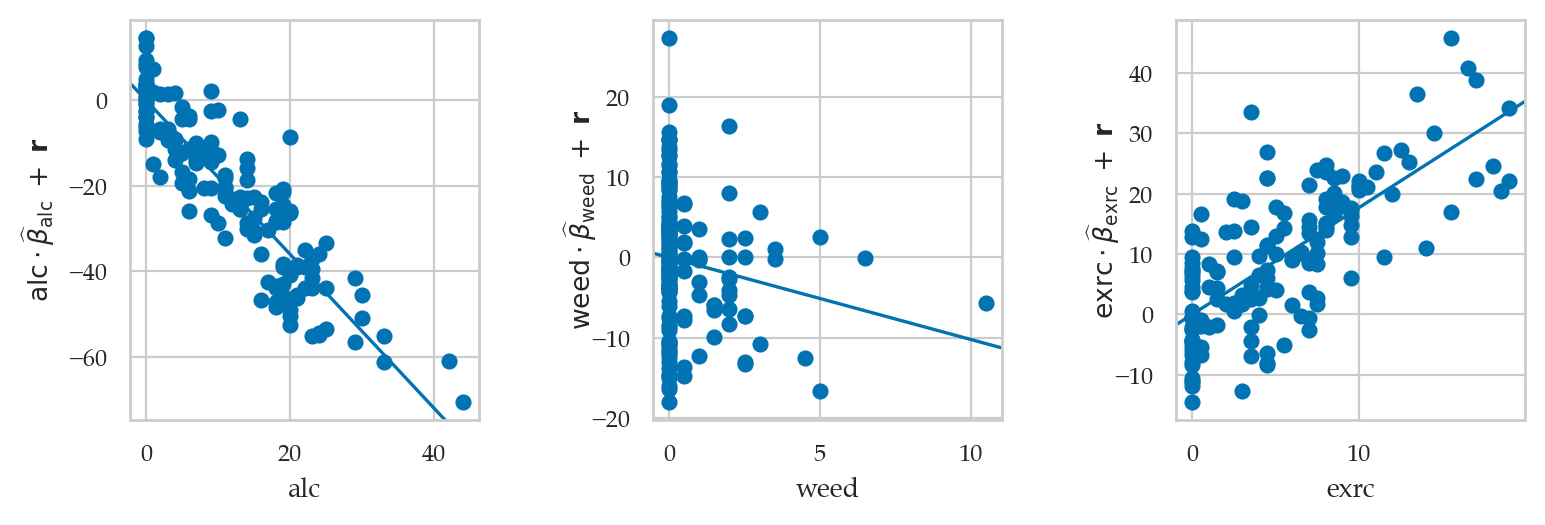
All-in-on convenience method
from statsmodels.graphics.api import plot_regress_exog

with plt.rc_context({"figure.figsize":(9,6)}):
    plot_regress_exog(lm2, "alc")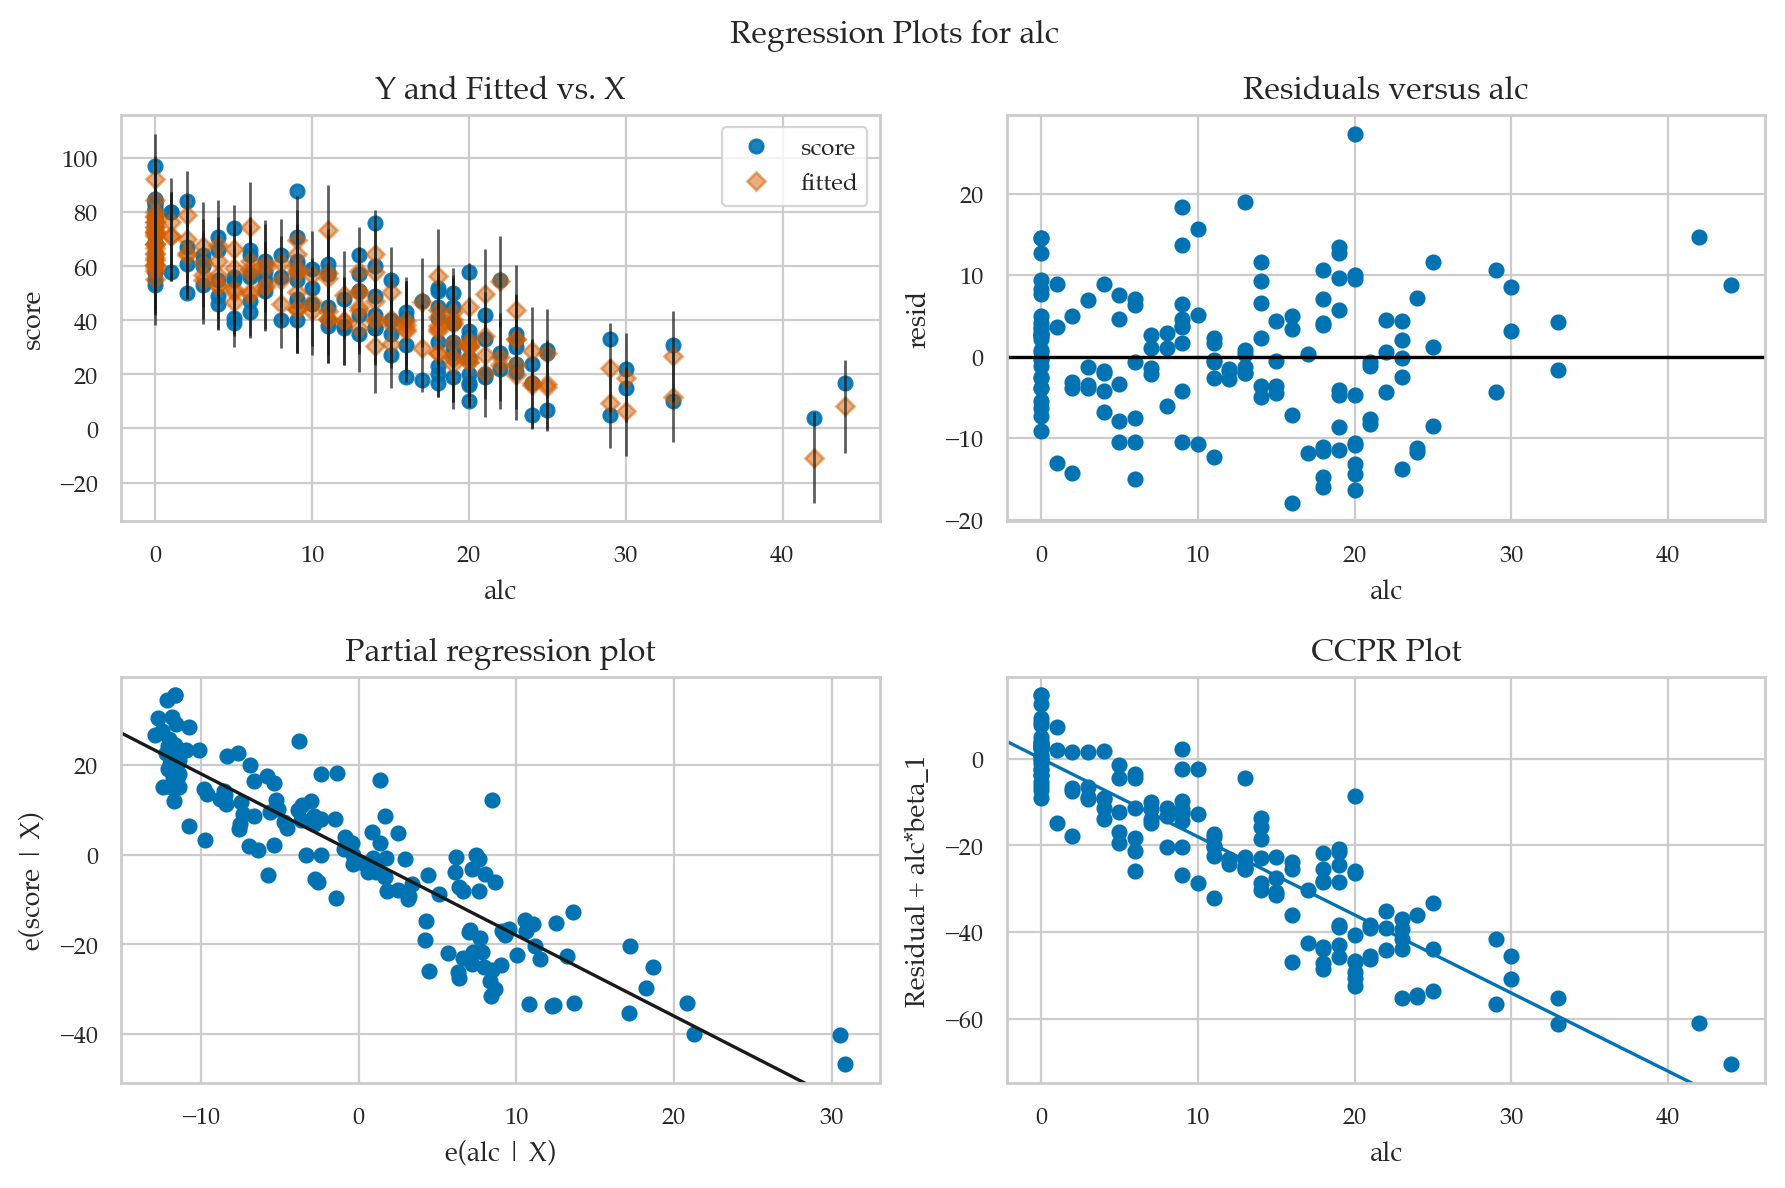
Exercises
E4.LOGNORM Non-normal error term
from scipy.stats import uniform, lognorm
np.random.seed(42)
xs = uniform(0,10).rvs(100)
ys = 2*xs + lognorm(1).rvs(100)
df = pd.DataFrame({"x":xs, "y":ys})
lm = smf.ols("y ~ x", data=df).fit()
qqplot(lm.resid, line="q");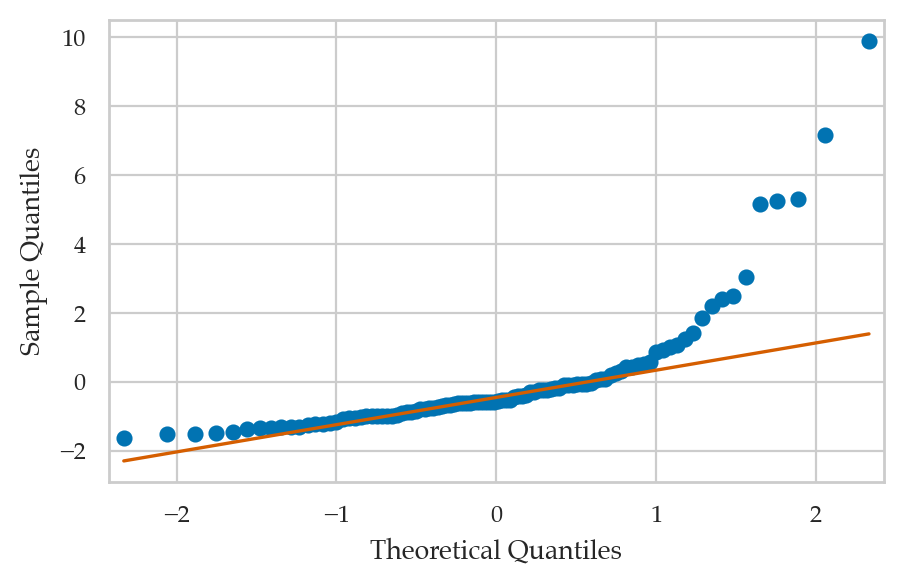
# sns.scatterplot(x=xs, y=lm.resid);# from ministats import plot_lm_scale_loc
# plot_lm_scale_loc(lm);E4.DEP Dependent error term
from scipy.stats import uniform, lognorm

np.random.seed(42)
xs = uniform(0,10).rvs(100)
ys = 2*xs + xs**2 + norm(0,1).rvs(100)
df = pd.DataFrame({"x":xs, "y":ys})
lm = smf.ols("y ~ 1 + x", data=df).fit()
lm.params
Intercept -14.684585
x 11.688188
dtype: float64from ministats import plot_reg
plot_reg(lm);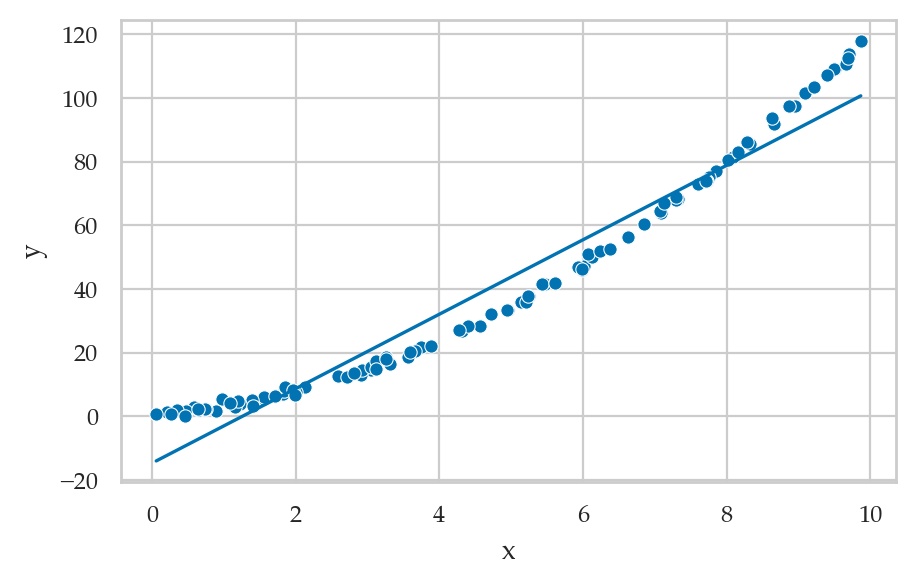
plot_resid(lm, lowess=True);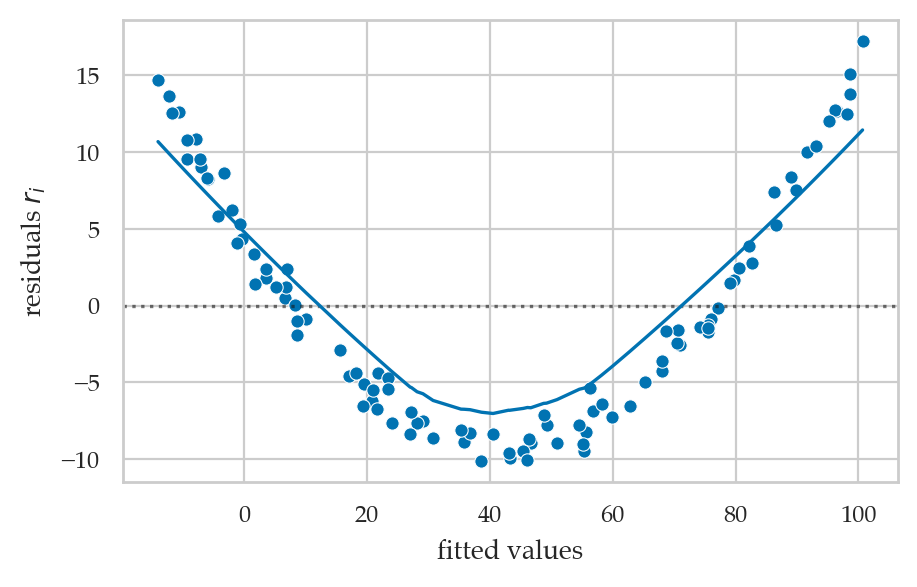
qqplot(lm.resid, line="q");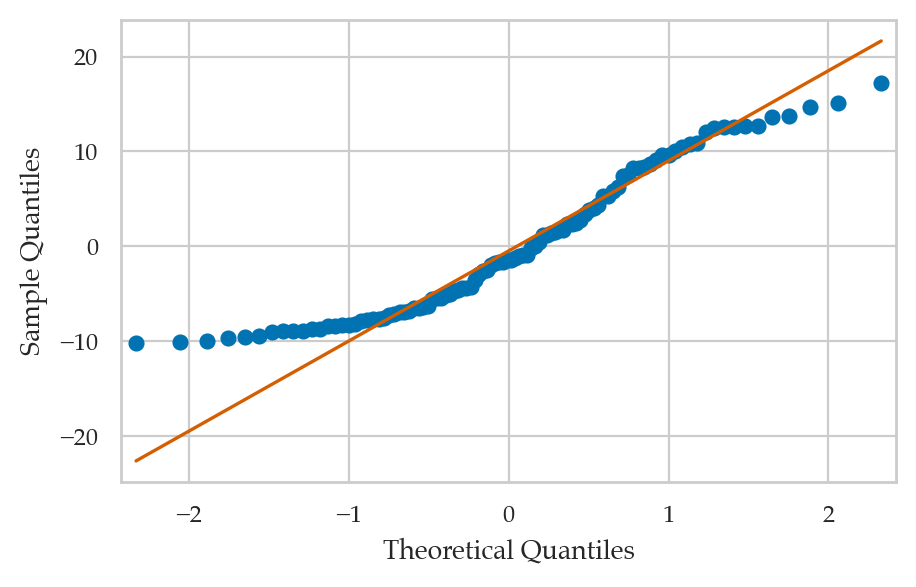
E4.H Heteroskedasticity
from scipy.stats import uniform, norm

np.random.seed(43)
xs = np.sort(uniform(0,10).rvs(100))
sigmas = np.linspace(1,20,100)
ys = 2*xs + norm(loc=0,scale=sigmas).rvs(100)
df = pd.DataFrame({"x":xs, "y":ys})
lm = smf.ols("y ~ x", data=df).fit()
from ministats import plot_scaleloc
plot_scaleloc(lm);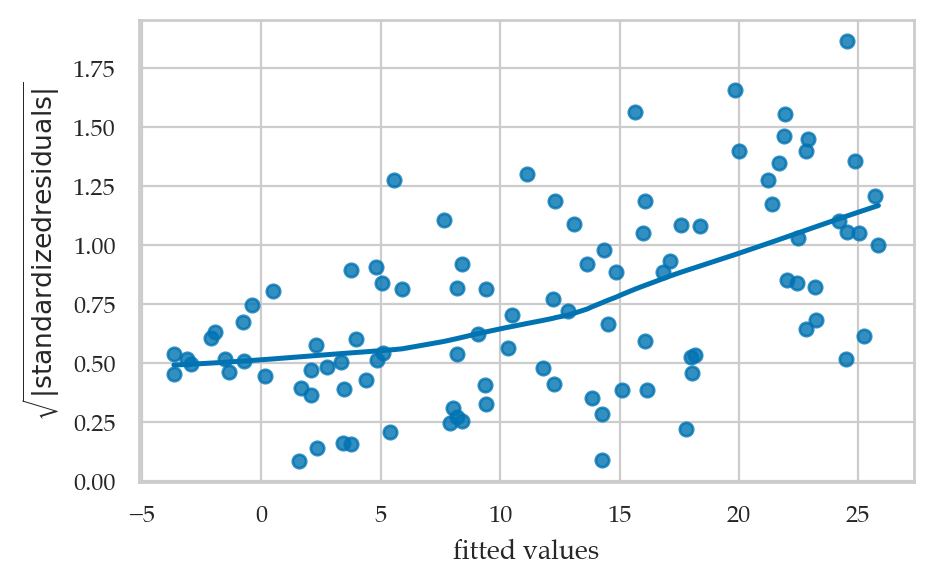
E4.v Collinearity
from scipy.stats import uniform, norm

np.random.seed(45)
x1s = uniform(0,10).rvs(100)
alpha = 0.8
x2s = alpha*x1s + (1-alpha)*uniform(0,10).rvs(100)
ys = 2*x1s + 3*x2s + norm(0,1).rvs(100)
df = pd.DataFrame({"x1":x1s, "x2":x2s, "y":ys})
lm = smf.ols("y ~ x1 + x2", data=df).fit()
lm.params, lm.bse
(Intercept 0.220927
x1 1.985774
x2 3.006225
dtype: float64,
Intercept 0.253988
x1 0.137253
x2 0.167492
dtype: float64)lm.condition_number24.291898486251153calc_lm_vif(lm, "x1"), calc_lm_vif(lm, "x2")(17.17244980334442, 17.17244980334442)Links
More details about model checking https://
ethanweed .github .io /pythonbook /05 .04 -regression .html #model -checking Statistical Modeling: The Two Cultures paper that explains the importance of out-of-sample predictions for statistical modelling.
https://projecteuclid .org /journals /statistical -science /volume -16 /issue -3 /Statistical -Modeling - -The -Two -Cultures -with -comments -and -a /10 .1214 /ss /1009213726 .full
CUT MATERIAL
Example dataset
TODO: convert to exercise in Sec 4.1
mtcars = sm.datasets.get_rdataset("mtcars", "datasets").data
mtcars

lmcars = smf.ols("mpg ~ hp", data=mtcars).fit()

sns.scatterplot(x=mtcars["hp"], y=mtcars["mpg"])
sns.lineplot(x=mtcars["hp"], y=lmcars.fittedvalues);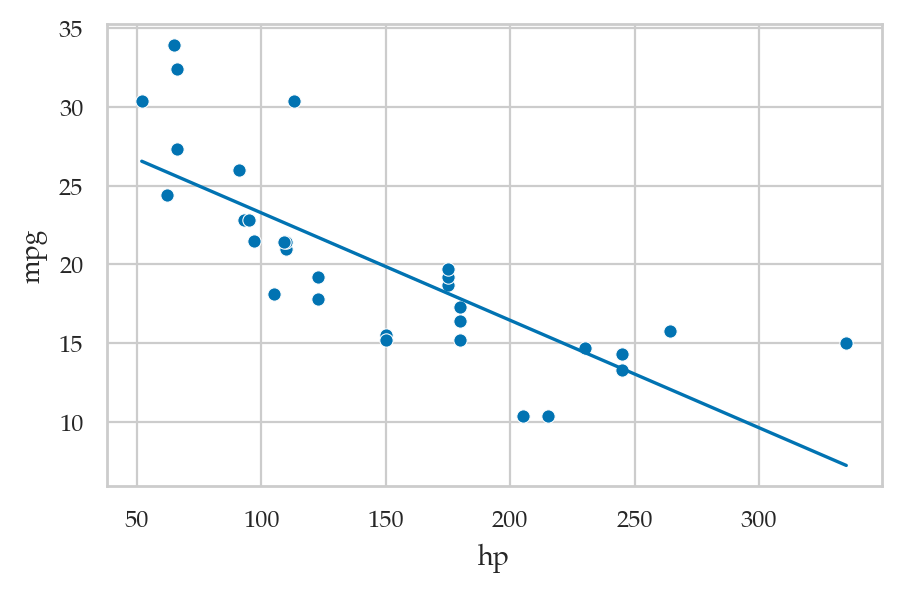
Compute the variance/covariance matrix
lm2.cov_params()
# == lm2.scale * np.linalg.inv(X.T @ X)
# where X = sm.add_constant(doctors[["alc","weed","exrc"]])