This notebook contains the code examples from Section 4.4 Regression with categorical predictors from the No Bullshit Guide to Statistics.
Notebook setup
# Ensure required Python modules are installed
%pip install --quiet numpy scipy seaborn pandas statsmodels ministats
[notice] A new release of pip is available: 26.2.1 -> 26.2.2
[notice] To update, run: pip install --upgrade pip
Note: you may need to restart the kernel to use updated packages.
# load Python modules
import numpy as np
import pandas as pd
import seaborn as sns
import matplotlib.pyplot as plt
import statsmodels.formula.api as smf# Figures setup
plt.clf() # needed otherwise `sns.set_theme` doesn't work
sns.set_theme(
context="paper",
style="whitegrid",
palette="colorblind",
rc={"font.family": "serif",
"font.serif": ["Palatino", "DejaVu Serif", "serif"],
"figure.figsize": (5, 1.6)},
)
%config InlineBackend.figure_format = 'retina'<Figure size 640x480 with 0 Axes># Simple float __repr__
if int(np.__version__.split(".")[0]) >= 2:
np.set_printoptions(legacy='1.25')# Download datasets/ directory if necessary
from ministats import ensure_datasets
ensure_datasets()datasets/ directory already exists.
Definitions
Design matrix for linear model lm1
students = pd.read_csv("datasets/students.csv")
lm1 = smf.ols("score ~ 1 + effort", data=students).fit()
lm1.model.exog[0:3]
array([[ 1. , 10.96],
[ 1. , 8.69],
[ 1. , 8.6 ]])students["effort"].values[0:3]array([10.96, 8.69, 8.6 ])Design matrix for linear model lm2
doctors = pd.read_csv("datasets/doctors.csv")
formula = "score ~ 1 + alc + weed + exrc"
lm2  = smf.ols(formula, data=doctors).fit()
lm2.model.exog[0:3]
array([[ 1. , 0. , 5. , 0. ],
[ 1. , 20. , 0. , 4.5],
[ 1. , 1. , 0. , 7. ]])doctors[["alc","weed","exrc"]].values[0:3]array([[ 0. , 5. , 0. ],
[20. , 0. , 4.5],
[ 1. , 0. , 7. ]])Example 1: binary predictor variable
import statsmodels.formula.api as smf
lmloc = smf.ols("score ~ 1 + C(loc)", data=doctors).fit()
lmloc.params
Intercept 52.956522
C(loc)[T.urb] -6.992885
dtype: float64from ministats.plots.figures import plot_lm_ttest
with plt.rc_context({"figure.figsize":(4.6,2.2)}):
ax = plot_lm_ttest(doctors, x="loc", y="score")
ax.set_ylim([25,90])
sns.move_legend(ax, "upper center")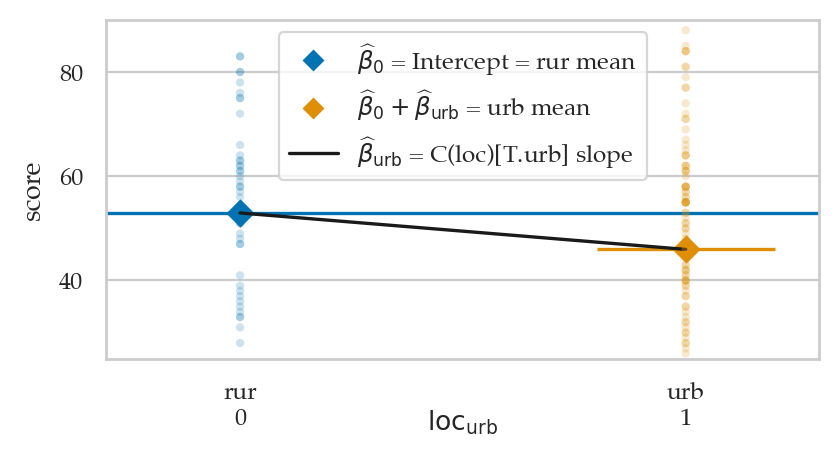
rur_mean = doctors[doctors["loc"]=="rur"]["score"].mean()
urb_mean = doctors[doctors["loc"]=="urb"]["score"].mean()

rur_mean, urb_mean, urb_mean - rur_mean
(52.95652173913044, 45.96363636363636, -6.992885375494076)Encoding
doctors["loc"][0:5]0 rur
1 urb
2 urb
3 urb
4 rur
Name: loc, dtype: strlmloc.model.exog[0:5]array([[1., 0.],
[1., 1.],
[1., 1.],
[1., 1.],
[1., 0.]])# ALT.
# dmatrix("1 + C(loc)", doctors)[0:5]Dummy coding for categorical predictors
cats = ["A", "B", "C", "C"]
catdf = pd.DataFrame({"cat":cats})
catdf
Loading...
from patsy import dmatrix

dmatrix("1 + C(cat)", data=catdf)
DesignMatrix with shape (4, 3)
Intercept C(cat)[T.B] C(cat)[T.C]
1 0 0
1 1 0
1 0 1
1 0 1
Terms:
'Intercept' (column 0)
'C(cat)' (columns 1:3)Example 2: predictors with three levels
doctors = pd.read_csv("datasets/doctors.csv")
doctors["work"].head(5)
0 hos
1 cli
2 hos
3 eld
4 cli
Name: work, dtype: strdmatrix("1 + C(work)", data=doctors)[0:5]array([[1., 0., 1.],
[1., 0., 0.],
[1., 0., 1.],
[1., 1., 0.],
[1., 0., 0.]])lmw = smf.ols("score ~ 1 + C(work)", data=doctors).fit()
lmw.paramsIntercept 46.545455
C(work)[T.eld] 4.569930
C(work)[T.hos] 2.668831
dtype: float64
lmw.rsquared0.0077217625749193lmw.fvalue, lmw.f_pvalue(0.5953116925291129, 0.5526627461285684)Example 3: improved model for the sleep scores
We can mix of numerical and categorical predictors
formula3 = "score ~ 1 + alc + weed + exrc + C(loc)"
lm3 = smf.ols(formula3, data=doctors).fit()
lm3.params
Intercept 63.606961
C(loc)[T.urb] -5.002404
alc -1.784915
weed -0.840668
exrc 1.783107
dtype: float64lm3.rsquared, lm3.aic(0.8544615790287664, 1092.5985552344712)from ministats import plot_partreg
plot_partreg(lm3, "alc");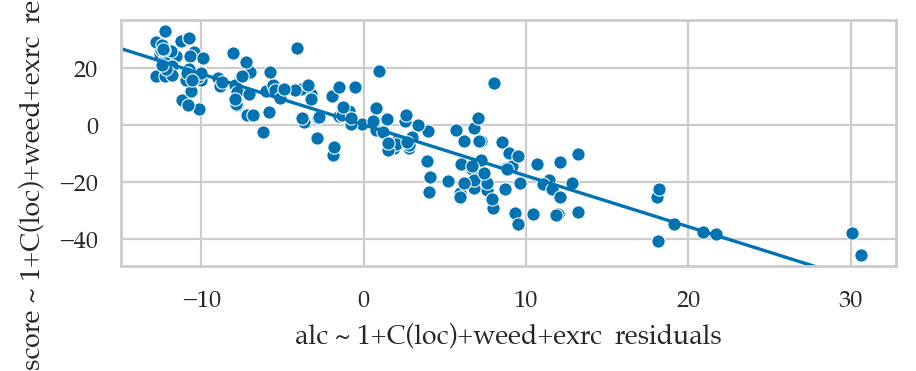
lm3.summary()Loading...
Compare to the model without loc predictor
formula2 = "score ~ 1 + alc + weed + exrc"
lm2 = smf.ols(formula2, data=doctors).fit()
F, p, _ = lm3.compare_f_test(lm2)
F, p
(12.758115596295502, 0.00047598123084921284)Everything is a linear model
One-sample t-test as a linear model
kombucha = pd.read_csv("datasets/kombucha.csv")
ksample04 = kombucha[kombucha["batch"]==4]["volume"]
ksample04.mean()1003.8335from scipy.stats import ttest_1samp
resk = ttest_1samp(ksample04, popmean=1000)
resk.statistic, resk.pvalue(3.087703149420272, 0.0037056653503329644)# # ALT. using the helper function from `ministats`
# from ministats import ttest_mean
# ttest_mean(ksample04, mu0=1000)# Prepare zero-centered data (volume - 1000)
kdat04 = pd.DataFrame()
kdat04["zcvolume"] = ksample04 - 1000
# Fit linear model with only an intercept term
import statsmodels.formula.api as smf
lmk = smf.ols("zcvolume ~ 1", data=kdat04).fit()
lmk.paramsIntercept 3.8335
dtype: float64lmk.tvalues.iloc[0], lmk.pvalues.iloc[0](3.0877031494203044, 0.0037056653503326456)Two-sample t-test as a linear model
East vs. West electricity prices
eprices = pd.read_csv("datasets/eprices.csv")
pricesW = eprices[eprices["loc"]=="West"]["price"]
pricesE = eprices[eprices["loc"]=="East"]["price"]
pricesW.mean() - pricesE.mean()3.000000000000001Two-sample t-test with pooled variance
from scipy.stats import ttest_ind
rese = ttest_ind(pricesW, pricesE, equal_var=True)
rese.statistic, rese.pvalue
(5.022875513276465, 0.00012497067987678515)ci_Delta = rese.confidence_interval(confidence_level=0.9)
[ci_Delta.low, ci_Delta.high][1.9572405258731593, 4.042759474126842]Linear model approach
lme = smf.ols("price ~ 1 + C(loc)", data=eprices).fit()
print(lme.params)
lme.tvalues.iloc[1], lme.pvalues.iloc[1]
Intercept 6.155556
C(loc)[T.West] 3.000000
dtype: float64
(5.022875513276466, 0.00012497067987678472)lme.conf_int(alpha=0.1).iloc[1].valuesarray([1.95724053, 4.04275947])from ministats.plots.figures import plot_lm_ttest
with plt.rc_context({"figure.figsize":(4.2,3.1)}):
ax = plot_lm_ttest(eprices, x="loc", y="price")
ax.set_ylim([4.5,10])
sns.move_legend(ax, "upper left")
ax.xaxis.set_label_coords(0.5, -0.07)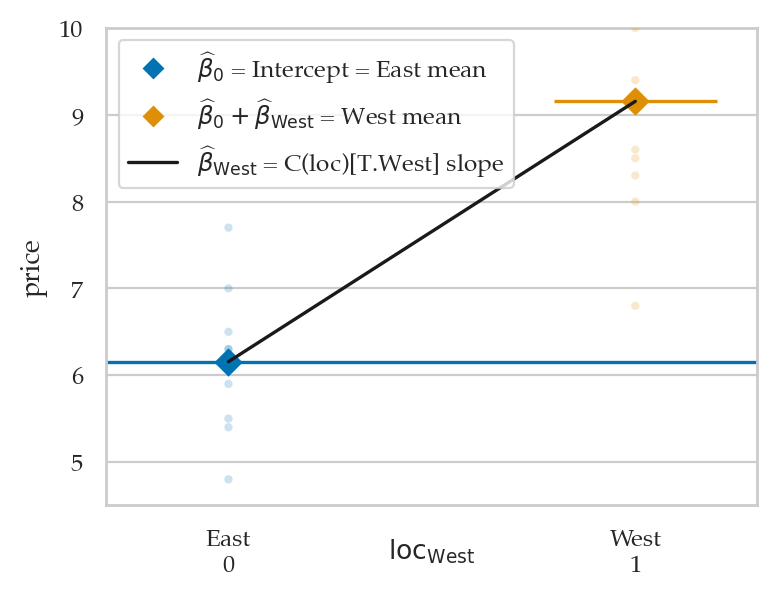
Example 1 (revisited): urban vs. rural doctors
from scipy.stats import ttest_ind

scoresR = doctors[doctors["loc"]=="rur"]["score"]
scoresU = doctors[doctors["loc"]=="urb"]["score"]

resloc = ttest_ind(scoresU, scoresR, equal_var=True)
resloc.statistic, resloc.pvalue
(-1.9657612140164198, 0.051124603539793693)lmloc = smf.ols("score ~ 1 + C(loc)", data=doctors).fit()
lmloc.tvalues.iloc[1], lmloc.pvalues.iloc[1](-1.9657612140164178, 0.05112460353979393)One-way ANOVA as a linear model
from scipy.stats import f_oneway

scoresH = doctors[doctors["work"]=="hos"]["score"]
scoresC = doctors[doctors["work"]=="cli"]["score"]
scoresE = doctors[doctors["work"]=="eld"]["score"]

resw = f_oneway(scoresH, scoresC, scoresE)
resw.statistic, resw.pvalue
(0.5953116925291181, 0.5526627461285655)lmw = smf.ols("score ~ 1 + C(work)", data=doctors).fit()
print(lmw.params)
lmw.fvalue, lmw.f_pvalueIntercept 46.545455
C(work)[T.eld] 4.569930
C(work)[T.hos] 2.668831
dtype: float64
(0.5953116925291129, 0.5526627461285684)from ministats.plots.figures import plot_lm_anova
with plt.rc_context({"figure.figsize":(5,3)}):
ax = plot_lm_anova(doctors, x="work", y="score")
ax.set_ylim([31,69])
sns.move_legend(ax, "lower right")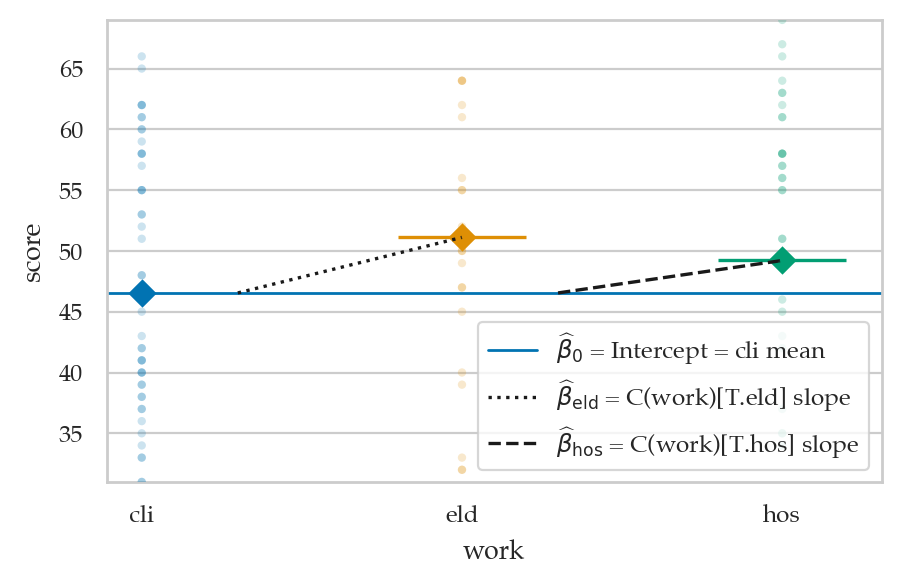
# BONUS: print ANOVA table
# import statsmodels.api as sm
# sm.stats.anova_lm(lmw)
Nonparametric tests
One-sample Wilcoxon signed-rank test
kombucha = pd.read_csv("datasets/kombucha.csv")
ksample04 = kombucha[kombucha["batch"]==4]["volume"]

# Zero-centered volumes
zcksample04 = ksample04 - 1000

from scipy.stats import wilcoxon
reswil = wilcoxon(zcksample04)
reswil.pvalue0.002770629538645153# Create a new data frame with the signed ranks of the volumes
df_zcsr = pd.DataFrame()
df_zcsr["zcvolume_sr"] = np.sign(zcksample04) * zcksample04.abs().rank()
lmwil = smf.ols("zcvolume_sr ~ 1", data=df_zcsr).fit()
lmwil.pvalues.iloc[0]0.002284150845974416Mann-Whitney U-test
scoresR = doctors[doctors["loc"]=="rur"]["score"]
scoresU = doctors[doctors["loc"]=="urb"]["score"]

from scipy.stats import mannwhitneyu
resmwu = mannwhitneyu(scoresU, scoresR)
resmwu.pvalue0.05008336985073764# Compute the (unsigned) ranks of the scores
doctors["score_r"] = doctors["score"].rank()
# Fit a linear model
lmmwu = smf.ols("score_r ~ 1 + C(loc)", data=doctors).fit()
lmmwu.pvalues.iloc[1]0.04953388746998925Kruskal-Wallis analysis of variance by ranks
from scipy.stats import kruskal
reskw = kruskal(scoresH, scoresC, scoresE)
reskw.pvalue0.4441051932875236# Compute the (unsigned) ranks of the scores
doctors["score_r"] = doctors["score"].rank()
lmkw = smf.ols("score_r ~ 1 + C(work)", data=doctors).fit()
lmkw.f_pvalue0.4468887214966093Explanations
Dummy coding options
dmatrix("cat", data=catdf)DesignMatrix with shape (4, 3)
Intercept cat[T.B] cat[T.C]
1 0 0
1 1 0
1 0 1
1 0 1
Terms:
'Intercept' (column 0)
'cat' (columns 1:3)dmatrix("C(cat)", data=catdf)DesignMatrix with shape (4, 3)
Intercept C(cat)[T.B] C(cat)[T.C]
1 0 0
1 1 0
1 0 1
1 0 1
Terms:
'Intercept' (column 0)
'C(cat)' (columns 1:3)dmatrix("C(cat, Treatment)", data=catdf)DesignMatrix with shape (4, 3)
Intercept C(cat, Treatment)[T.B] C(cat, Treatment)[T.C]
1 0 0
1 1 0
1 0 1
1 0 1
Terms:
'Intercept' (column 0)
'C(cat, Treatment)' (columns 1:3)dmatrix("C(cat, Treatment('B'))", data=catdf)
# ALT. dmatrix("C(cat, Treatment(1))", data=catdf)DesignMatrix with shape (4, 3)
Intercept C(cat, Treatment('B'))[T.A] C(cat, Treatment('B'))[T.C]
1 1 0
1 0 0
1 0 1
1 0 1
Terms:
'Intercept' (column 0)
"C(cat, Treatment('B'))" (columns 1:3)Avoiding perfect collinearity
df_col = pd.DataFrame()
df_col["iscli"] = (doctors["work"] == "cli").astype(int)
df_col["iseld"] = (doctors["work"] == "eld").astype(int)
df_col["ishos"] = (doctors["work"] == "hos").astype(int)
df_col["score"] = doctors["score"]
formula_col = "score ~ 1 + iscli + iseld + ishos"
lm_col = smf.ols(formula_col, data=df_col).fit()
lm_col.paramsIntercept 36.718781
iscli 9.826673
iseld 14.396603
ishos 12.495504
dtype: float64lm_col.condition_number4496839867074116.0lm2.paramsIntercept 60.452901
alc -1.800101
weed -1.021552
exrc 1.768289
dtype: float64Discussion
Other coding strategies for categorical variables
dmatrix("0 + C(cat)", data=catdf)DesignMatrix with shape (4, 3)
C(cat)[A] C(cat)[B] C(cat)[C]
1 0 0
0 1 0
0 0 1
0 0 1
Terms:
'C(cat)' (columns 0:3)dmatrix("1 + C(cat, Sum)", data=catdf)DesignMatrix with shape (4, 3)
Intercept C(cat, Sum)[S.A] C(cat, Sum)[S.B]
1 1 0
1 0 1
1 -1 -1
1 -1 -1
Terms:
'Intercept' (column 0)
'C(cat, Sum)' (columns 1:3)dmatrix("1+C(cat, Diff)", data=catdf)DesignMatrix with shape (4, 3)
Intercept C(cat, Diff)[D.A] C(cat, Diff)[D.B]
1 -0.66667 -0.33333
1 0.33333 -0.33333
1 0.33333 0.66667
1 0.33333 0.66667
Terms:
'Intercept' (column 0)
'C(cat, Diff)' (columns 1:3)dmatrix("C(cat, Helmert)", data=catdf)DesignMatrix with shape (4, 3)
Intercept C(cat, Helmert)[H.B] C(cat, Helmert)[H.C]
1 -1 -1
1 1 -1
1 0 2
1 0 2
Terms:
'Intercept' (column 0)
'C(cat, Helmert)' (columns 1:3)Exercises
EXX: redo comparison of debate and lectures scores
students = pd.read_csv("datasets/students.csv")
lmcu = smf.ols("score ~ 1 + C(curriculum)", data=students).fit()
lmcu.tvalues.iloc[1], lmcu.pvalues.iloc[1]
(-1.7197867420465645, 0.10917234443214427)EXX: model comparison
formula3w = "score ~ 1 + alc + weed + exrc + C(loc) + C(work)"
lm3w = smf.ols(formula3w, data=doctors).fit()

formula3 = "score ~ 1 + alc + weed + exrc + C(loc)"
lm3 = smf.ols(formula3, data=doctors).fit()

lm3w.compare_f_test(lm3)
(1.5158185269523023, 0.22299549360240414, 2.0)The result is non-significant which means including the predictor C(work)
in the model is not useful.
EXX: run ANOVA test
# Construct data as a pd.DataFrame
np.random.seed(42)
As = np.random.normal(0, 1, 20)
Bs = np.random.normal(-2, 1, 20)
Cs = np.random.normal(3, 1, 20)
Ds = np.random.normal(1.5, 1, 20)

dfABCD = pd.DataFrame()
dfABCD["group"] = ["A"]*20 + ["B"]*20 + ["C"]*20 + ["D"]*20
dfABCD["value"] = np.concatenate([As, Bs, Cs, Ds])

with plt.rc_context({"figure.figsize":(8,6)}):
    ax = plot_lm_anova(dfABCD, x="group", y="value")

from scipy.stats import f_oneway
resABCD = f_oneway(As, Bs, Cs, Ds)
print(resABCD.statistic, resABCD.pvalue)

lmabcd =  smf.ols("value ~ C(group)", data=dfABCD).fit()
lmabcd.fvalue, lmabcd.f_pvalue
107.22963883851017 3.091116115443279e-27
(107.22963883851006, 3.091116115443411e-27)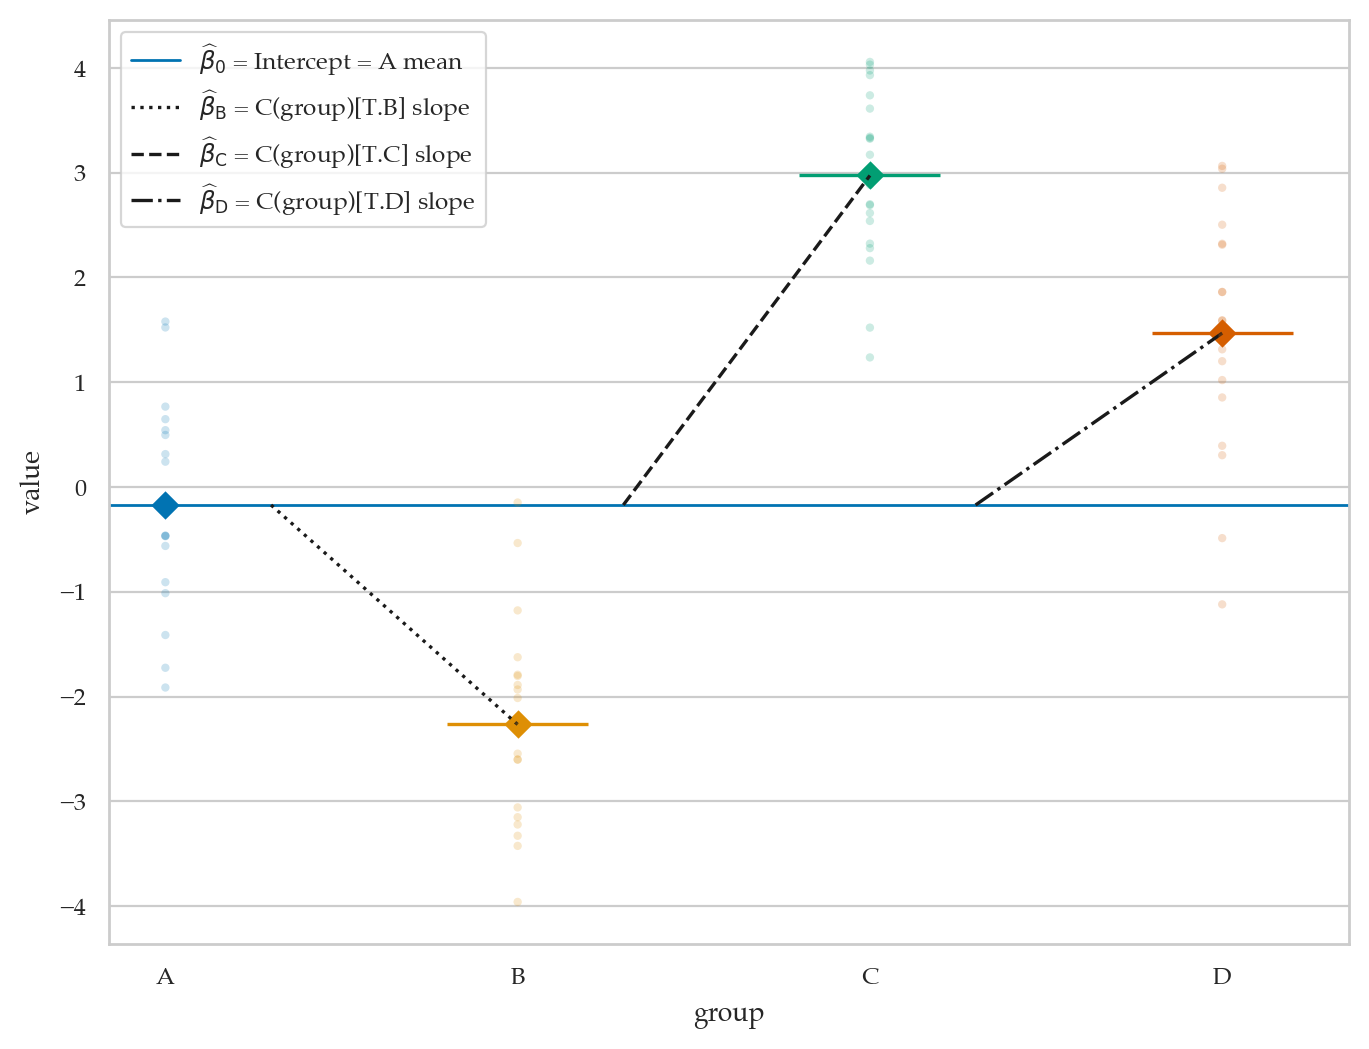
Links
Patsy and Statsmodels https://
www .youtube .com /watch ?v = iEANEcWqAx4 Tests as LMs: https://
lindeloev .github .io /tests -as -linear/ https://
danielroelfs .com /blog /everything -is -a -linear -model/ via HN