This notebook contains all the code examples from Section 2.6 Inventory of continuous distributions of the No Bullshit Guide to Statistics.
Notebook setup
# Ensure required Python modules are installed
%pip install --quiet numpy scipy seaborn ministats
[notice] A new release of pip is available: 26.0.1 -> 26.1.2
[notice] To update, run: /Users/ivan/Projects/Minireference/STATSbook/noBSstats/venv/bin/python3.12 -m pip install --upgrade pip
Note: you may need to restart the kernel to use updated packages.
# load Python modules
import numpy as np
import seaborn as sns
import matplotlib.pyplot as plt
from ministats import plot_pdf
from ministats import plot_cdf
from ministats import plot_pdf_and_cdf# Figures setup
plt.clf() # needed otherwise `sns.set_theme` doesn't work
sns.set_theme(
context="paper",
style="whitegrid",
palette="colorblind",
rc={"font.family": "serif",
"font.serif": ["Palatino", "DejaVu Serif", "serif"],
"figure.figsize": (6,2)},
)
%config InlineBackend.figure_format = "retina"<Figure size 640x480 with 0 Axes># Simple float __repr__
import numpy as np
if int(np.__version__.split(".")[0]) >= 2:
np.set_printoptions(legacy='1.25')
# Set random seed for repeatability
np.random.seed(42)Uniform distribution
The uniform distribution is described by the following probability density function:
For a uniform distribution , each between and is equally likely to occur, and values of outside this range have zero probability of occurring.
from scipy.stats import uniform
alpha = 2
beta = 7
rvU = uniform(alpha, beta-alpha)
# draw 10 random samples from X
rvU.rvs(10)array([3.87270059, 6.75357153, 5.65996971, 4.99329242, 2.7800932 ,
2.7799726 , 2.29041806, 6.33088073, 5.00557506, 5.54036289])plot_pdf(rvU, xlims=[0,9]);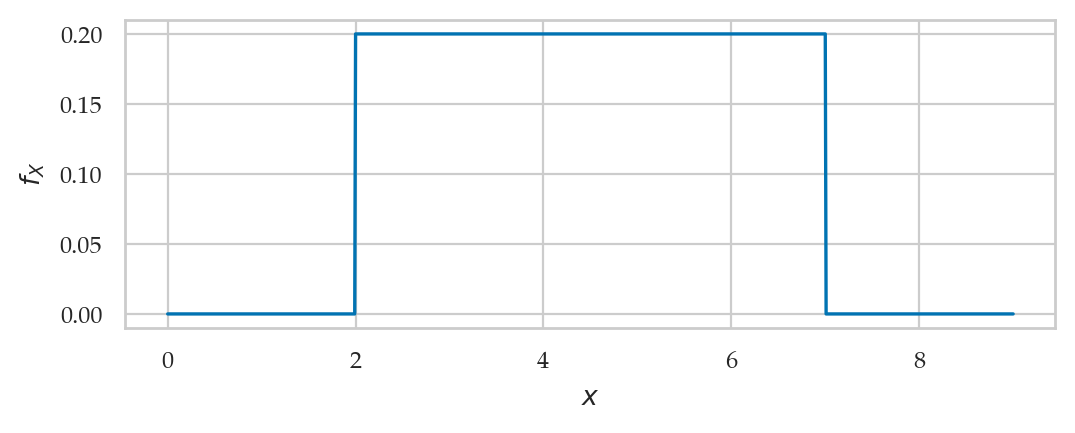
# # ALT. use sns.lineplot
# # plot the probability density function (pdf) of the random variable X
# xs = np.linspace(0, 10, 1000)
# fUs = rvU.pdf(xs)
# sns.lineplot(x=xs, y=fUs)
Cumulative distribution function
plot_pdf_and_cdf(rvU, xlims=[0,9]);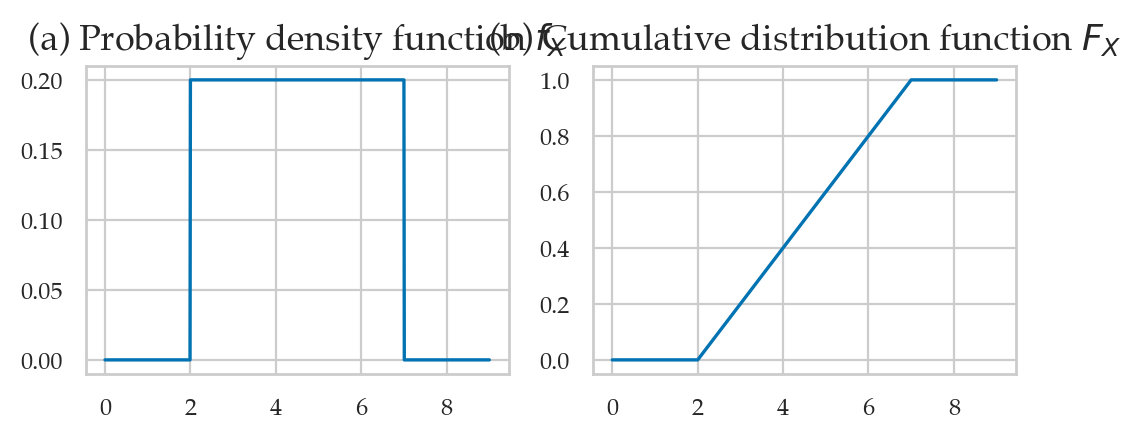
Standard uniform distribution
The standard uniform distribution is described by the following probability density function:
where is the name of the random variable and are particular values it can take on.
The above equation describes tells you how likely it is to observe . For a uniform distribution , each between 0 and 1 is equally likely to occur, and values of outside this range have zero probability of occurring.
from scipy.stats import uniform

rvUs = uniform(0, 1)
# draw 10 random samples from X
rvUs.rvs(1)array([0.02058449])import random
random.seed(3)random.random()0.23796462709189137random.uniform(0,1)0.5442292252959519import numpy as np
np.random.seed(42)
np.random.rand(10)array([0.37454012, 0.95071431, 0.73199394, 0.59865848, 0.15601864,
0.15599452, 0.05808361, 0.86617615, 0.60111501, 0.70807258])plot_pdf_and_cdf(rvUs, xlims=[-1,2]);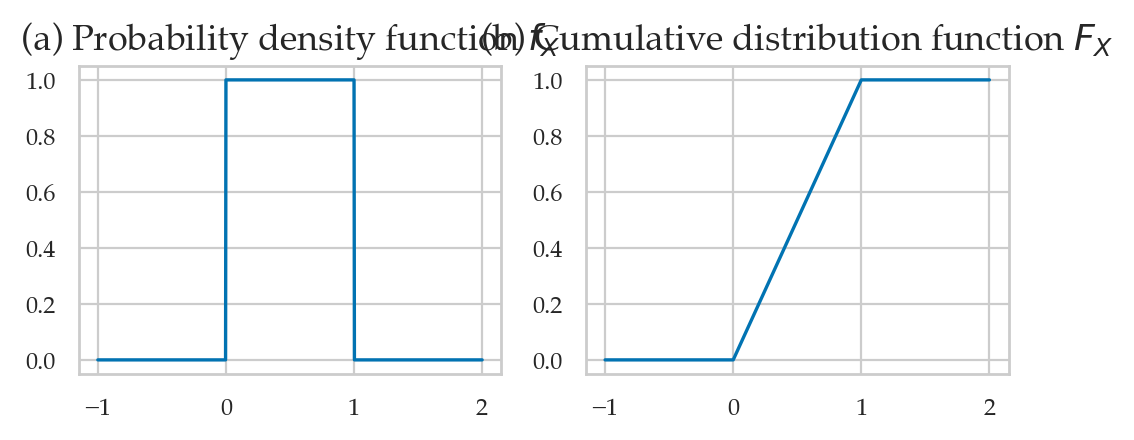
Simulating other random variables
We can use the uniform random variable to generate random variables from other distributions.
For example,
suppose we want to generate observations of a coin toss random variable
which comes out heads 50% of the time and tails 50% of the time.
We can use the standard uniform random variables obtained from random.random()
and split the outcomes at the “halfway point” of the sample space,
to generate the 50-50 randomness of a coin toss.
The function flip_coin defined below shows how to do this:
def flip_coin():
    u = random.random()  # random number in [0,1]
    if u < 0.5:
        return "heads"
    else:
        return "tails"
# simulate one coin toss
flip_coin()'heads'# simulate 10 coin tosses
[flip_coin() for i in range(0,10)]['tails',
'tails',
'heads',
'heads',
'tails',
'heads',
'heads',
'tails',
'heads',
'tails']Exponential distribution
from scipy.stats import expon

lam = 7
rvE = expon(loc=0, scale=1/lam)
To create the model rvE,
we had to specify a location parameter loc,
which we set to zero,
and a scale parameter,
which we set to the inverse of the rate parameter .
The location parameter can be used to shift the exponential distribution to the right,
but we set loc=0 to get the simple case that corresponds to the un-shifted distribution .
rvE.mean(), rvE.var()(0.14285714285714285, 0.02040816326530612)# math formulas for mean and var
1/lam, 1/lam**2(0.14285714285714285, 0.02040816326530612)## ALT. we can obtain mean and ver using the .stats() method
## The code below also computes the skewness and the kurtosis
# mean, var, skew, kurt = rvE.stats(moments='mvsk')
# mean, var, skew, kurt# f_E(5) = pdf value at x=10
rvE.pdf(0.2)1.7261787475912451plot_pdf(rvE, xlims=[0,1.1]);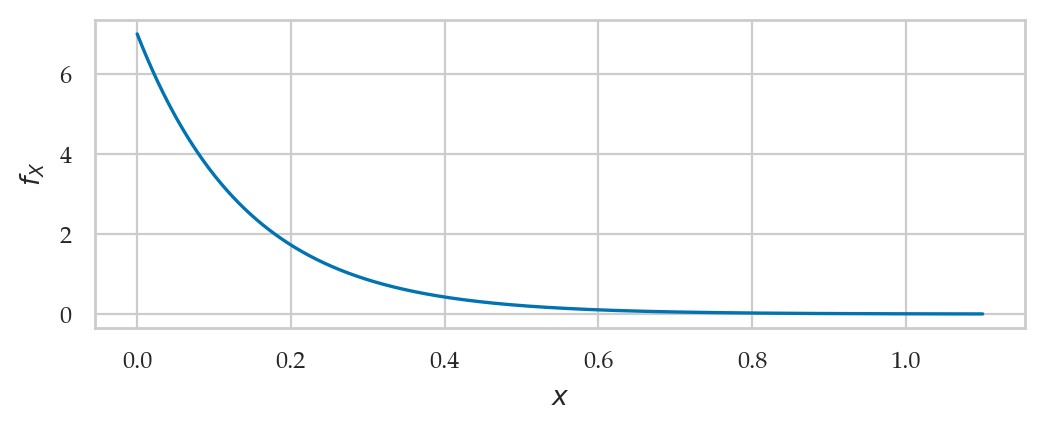
Normal distribution
A random variable with a normal distribution is described by the probability density function:
The mean and the standard deviation are called the parameters of the distribution. The math notation is used to describe the whole family of normal probability distributions.
from scipy.stats import norm

mu = 10    # = 𝜇   where is the centre?
sigma = 3  # = 𝜎   how spread out is it?

rvN = norm(mu, sigma)
rvN.mean(), rvN.var()(10.0, 9.0)plot_pdf(rvN, xlims=[-10,30]);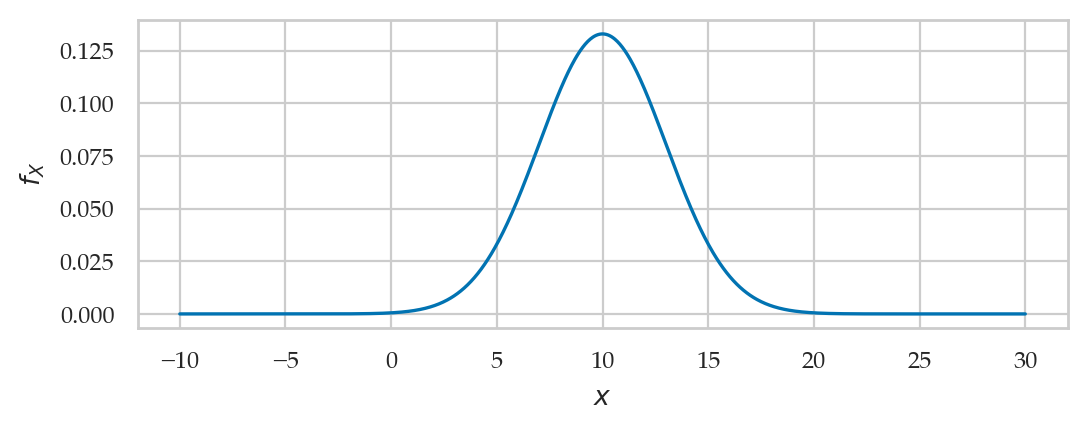
# ALT. generate the plot manually

# create a normal random variable
from scipy.stats import norm
mean = 1000   # 𝜇 (mu)    = where is its center?
std = 100     # 𝜎 (sigma) = how spread out is it?
rvN = norm(mean, std)

# plot its probability density function (pdf)
xs = np.linspace(300, 1700, 1000)
ys = rvN.pdf(xs)
ax = sns.lineplot(x=xs, y=ys)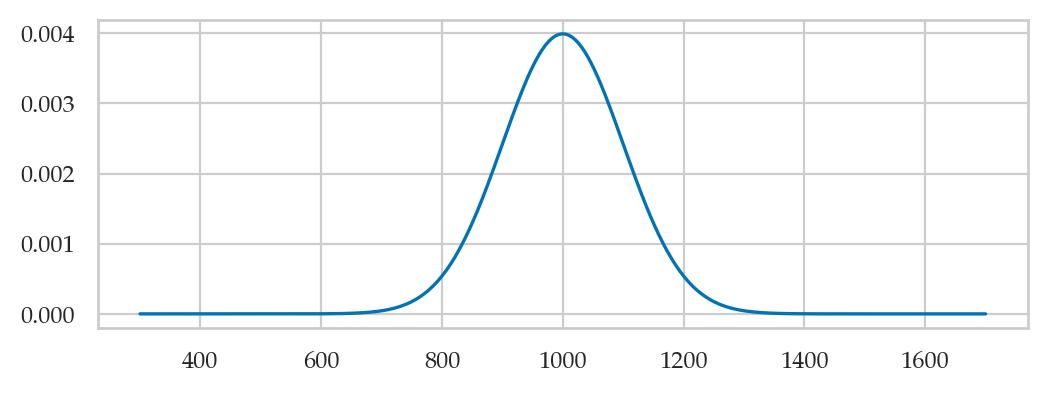
Standard normal distribution
A standard normal is denoted with a normal distribution and described by the probability density function:
from scipy.stats import norm

rvZ = norm(0,1)
rvZ.mean(), rvZ.var()(0.0, 1.0)plot_pdf(rvZ, xlims=[-4,4], rv_name="Z");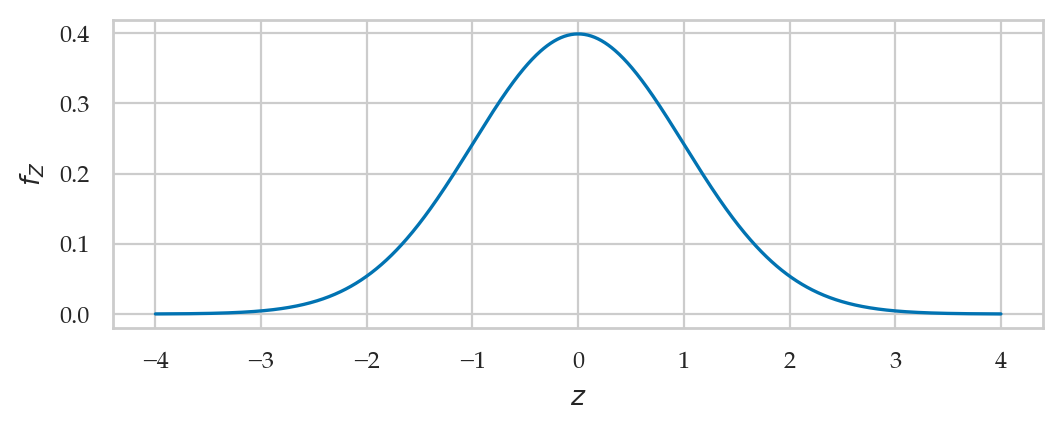
Cumulative probabilities in the tails
Probability of being smaller than -2.2.
rvZ.cdf(-2.3)0.01072411002167581Probability of being greater than 2.2.
1 - rvZ.cdf(2.3)0.010724110021675837Probability of .
rvZ.cdf(-2.3) + (1-rvZ.cdf(2.3))0.021448220043351646norm.cdf(-2.3,0,1) + (1-norm.cdf(2.3,0,1))0.021448220043351646Inverse cumulative distribution calculations
rvZ.ppf(0.05)-1.6448536269514729rvZ.ppf(0.95)1.644853626951472rvZ.interval(0.9)(-1.6448536269514729, 1.644853626951472)Mathematical interlude: the gamma function
Gamma function
from math import factorial
from scipy.special import gamma as gammaf

gammaf(1), factorial(0) # = 0! = 1
(1.0, 1)gammaf(2), factorial(1) # = 1! = 1(1.0, 1)gammaf(3), factorial(2) # = 2! = 2*1(2.0, 2)gammaf(4), factorial(3) # = 3! = 3*2*1(6.0, 6)gammaf(5), factorial(4) # = 4! = 4*3*2*1(24.0, 24)factorial(4.1)---------------------------------------------------------------------------
TypeError Traceback (most recent call last)
Cell In[46], line 1
----> 1 factorial(4.1)
TypeError: 'float' object cannot be interpreted as an integergammaf(5.1)27.93175373836837[gammaf(x) for x in [5, 5.1, 5.2, 5.5, 5.8, 5.9, 6]][24.0,
27.93175373836837,
32.578096050331354,
52.34277778455352,
85.6217375127053,
101.27019121310353,
120.0]# plot gammaf between 0 and 5
xs = np.linspace(0.05, 6, 1000)
fXs = gammaf(xs)
ax = sns.lineplot(x=xs, y=fXs, label="$\\Gamma(x)$")
ax.set_xlabel("$x$")
ax.set_ylabel(r"$\Gamma$")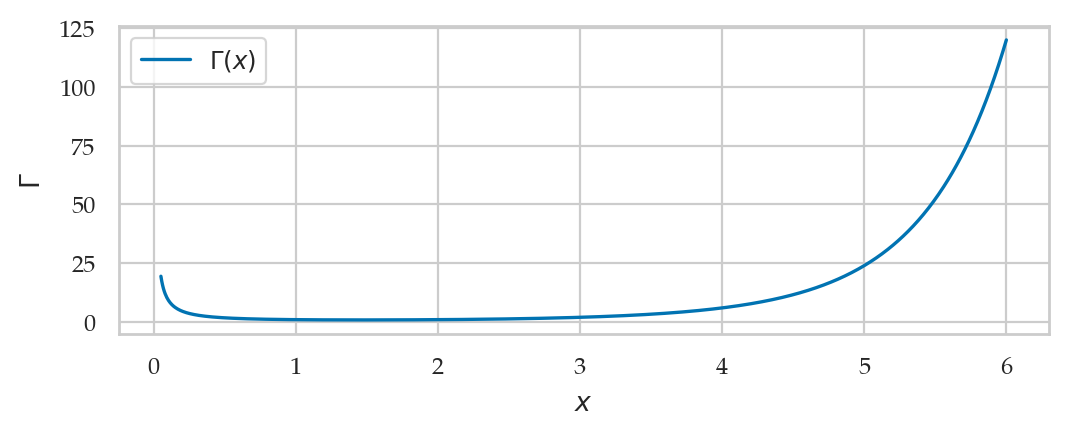
Student’s t-distribution
This is a generalization of the standard normal with “heavy” tails.
from scipy.stats import t as tdist

rvT = tdist(df=10)
ax = plot_pdf(rvT, xlims=[-5,5], label=f"tdist(10)")
plot_pdf(rvZ, xlims=[-5,5], ax=ax, label="Z");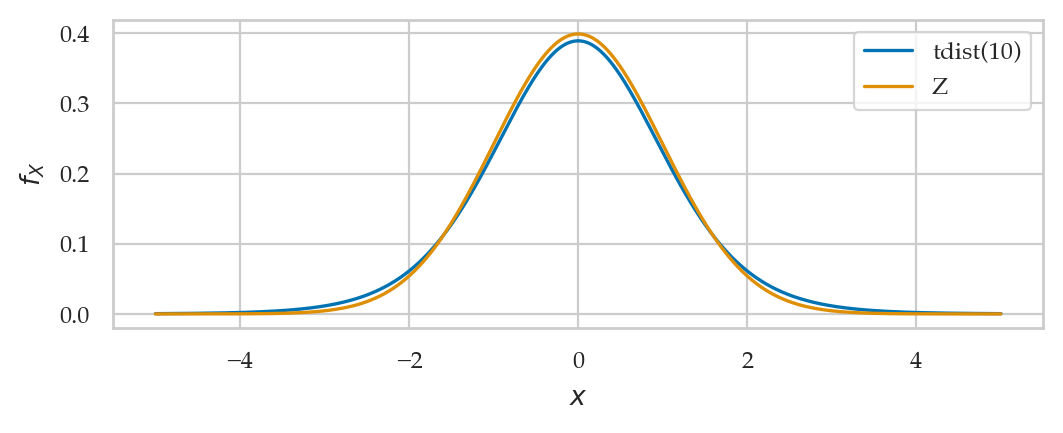
rvT.mean(), rvT.var()(0.0, 1.25)# Kurtosis formula kurt(rvT) = 6/(df-4) for df>4
rvT.stats("k")1.0rvT.cdf(-2.3)0.02212715664214358rvT.ppf(0.05), rvT.ppf(0.95)(-1.8124611228116767, 1.812461122811676)fig, ax = plt.subplots()
linestyles = ['solid', 'dashdot', 'dashed', 'dotted']
for i, df in enumerate([2,3,5,30]):
rvT = tdist(df)
linestyle = linestyles[i]
plot_pdf(rvT, xlims=[-5,5], ax=ax, label="$\\nu={}$".format(df), linestyle=linestyle)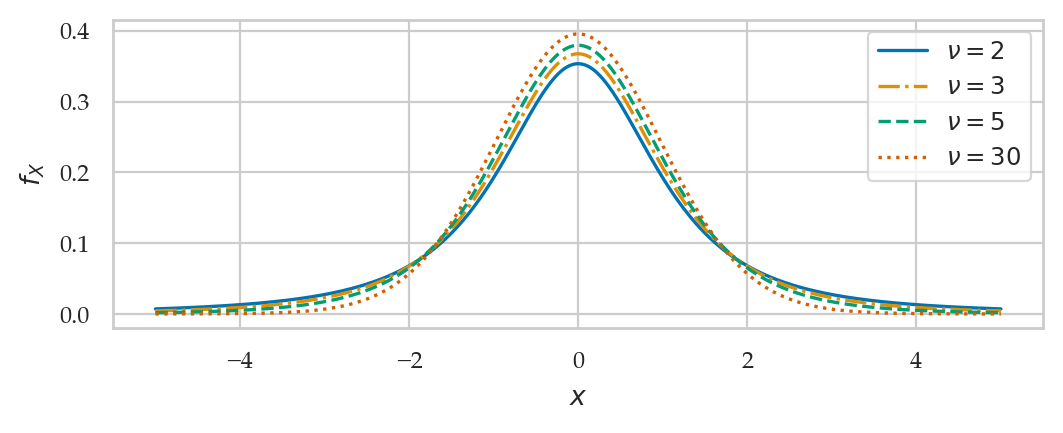
Chi-squared distribution
from scipy.stats import chi2

df = 10
rvX2 = chi2(df)
rvX2.mean(), rvX2.var()(10.0, 20.0)1 - rvX2.cdf(20)0.02925268807696113plot_pdf(rvX2, xlims=[0,40]);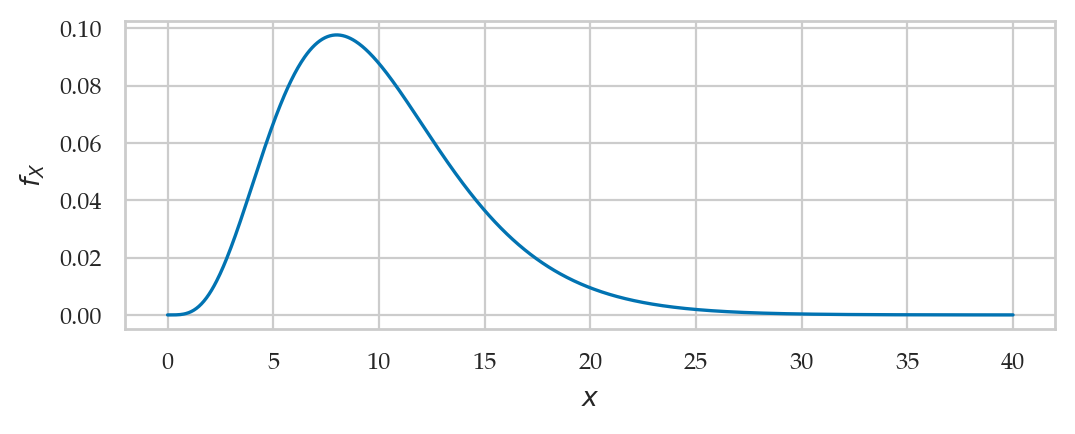
Fisher–Snedecor’s F-distribution
from scipy.stats import f as fdist

df1, df2 = 5, 10
rvF = fdist(df1, df2)
rvF.mean(), rvF.var()(1.25, 1.3541666666666667)plot_pdf(rvF, xlims=[0,5]);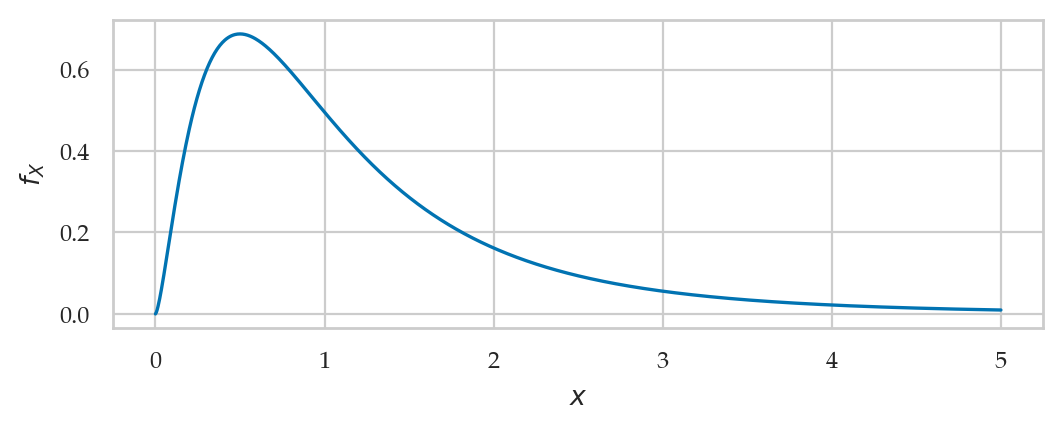
from scipy.stats import gamma as gammadist

alpha = 4
loc = 0
lam = 2
beta = 1/lam

rvG = gammadist(alpha, loc, beta)
rvG.mean(), rvG.var()(2.0, 1.0)plot_pdf(rvG, xlims=[0,7]);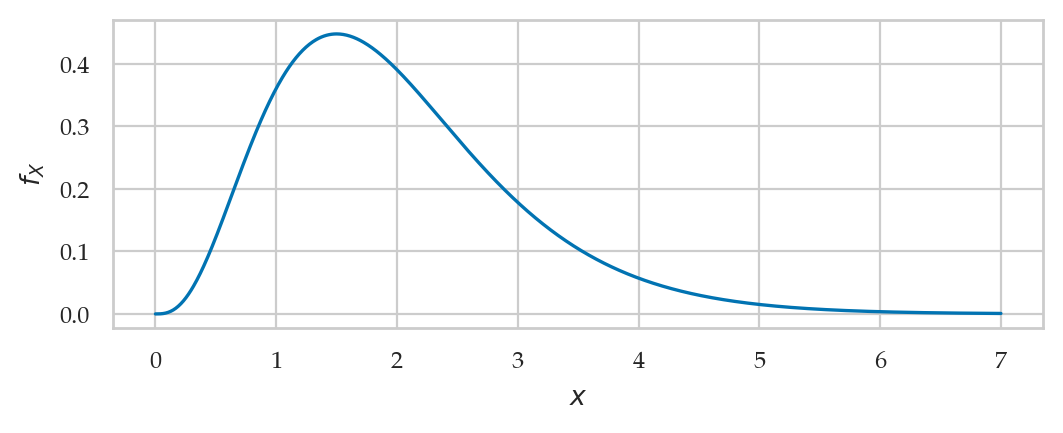
Beta distribution
from scipy.stats import beta as betadist

alpha = 3
beta = 7

rvB = betadist(alpha, beta)
rvB.mean(), rvB.var()(0.3, 0.019090909090909092)plot_pdf(rvB, xlims=[0,1]);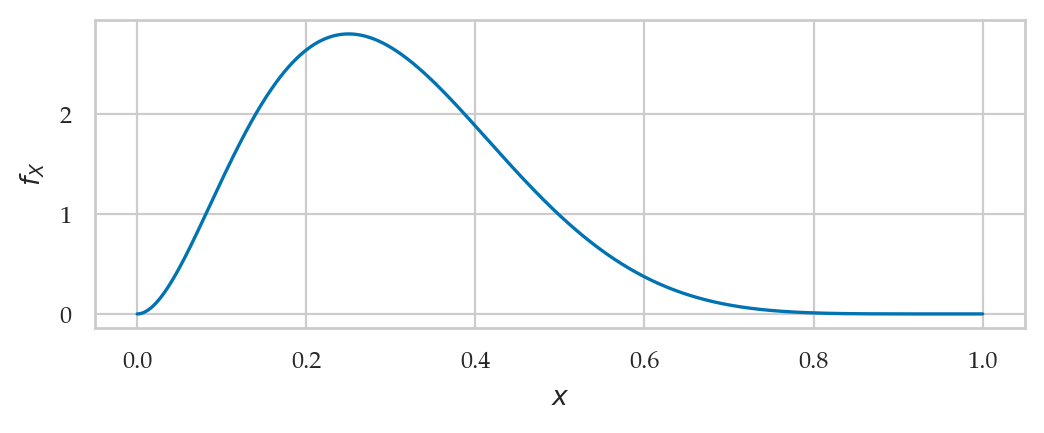
Laplace distribution
from scipy.stats import laplace

mu = 10
b = 3
rvL = laplace(mu, b)
rvL.mean(), rvL.var()(10.0, 18.0)plot_pdf(rvL, xlims=[-40,40]);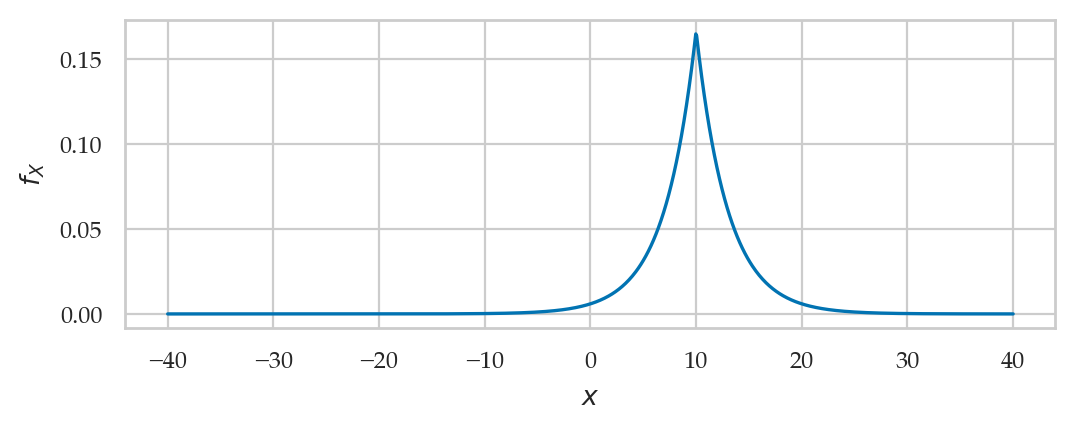
Explanations
Location-scale families
Normal location-scale family example
Exam question 1:
b = 109

muN = 100
sigmaN = 5

# standardize b
z_b = (b - muN) / sigmaN
z_b1.8from scipy.stats import norm
rvZ = norm(loc=0, scale=1)
1 - rvZ.cdf(z_b)0.03593031911292577Exam question 2:
z_l = rvZ.ppf(0.05)
z_u = rvZ.ppf(0.95)
[sigmaN*z_l + muN, sigmaN*z_u + muN]
[91.77573186524263, 108.22426813475735]Equivalent calculations using “custom” model
b = 109

rvN = norm(loc=100, scale=5)
1 - rvN.cdf(b)0.03593031911292577[rvN.ppf(0.05), rvN.ppf(0.95)][91.77573186524263, 108.22426813475735]Student’s t location-scale family
b = 109

locS = 100
scaleS = 5

t_b = (b - locS) / scaleS
t_b1.8from scipy.stats import t as tdist
rvT = tdist(df=6, loc=0, scale=1)
1 - rvT.cdf(t_b)0.06097621069194403Equivalent calculations using “custom” model
rvS = tdist(df=6, loc=100, scale=5)

1 - rvS.cdf(b)0.06097621069194403Uniform location-scale family
locV = 100
scaleV = 20

b = 115
u_b = (b - locV) / scaleV
u_b0.75from scipy.stats import uniform
rvU = uniform(0, 1)
1 - rvU.cdf(u_b)0.25rvV = uniform(100, 20)
1 - rvV.cdf(115)0.25Chi-square scale family
scaleS = 10

b = 150
q_b = 150 / scaleS

from scipy.stats import chi2
rvQ = chi2(df=7)
1 - rvQ.cdf(q_b)0.03599940476342878rvS = chi2(df=7, scale=10)
1 - rvS.cdf(150)0.03599940476342878Discussion
Relations between distributions
SEE BOOK
Continuity correction
from scipy.stats import poisson
from ministats import plot_pmf
rvH = poisson(20)
ax = plot_pmf(rvH)

rvN = norm(20, np.sqrt(20))
plot_pdf(rvN, xlims=[0,40], ax=ax);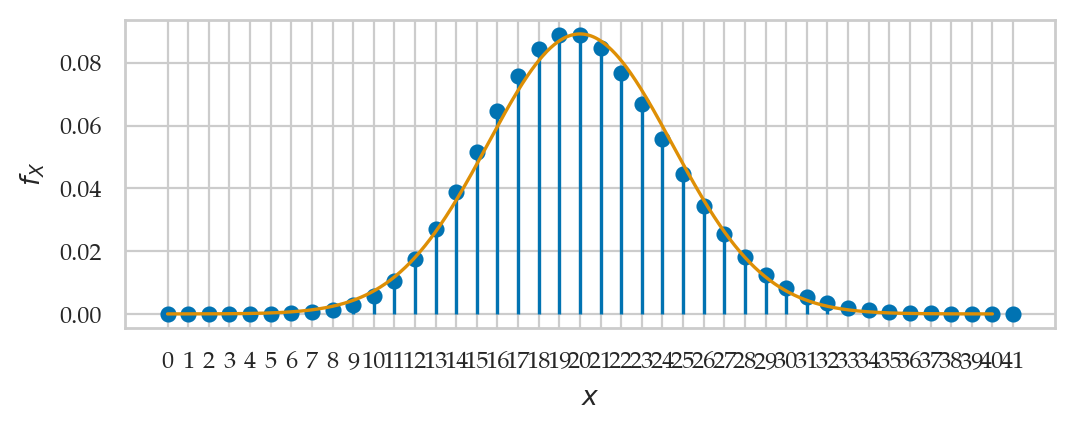
# TODO: example