This notebook contains all the code examples from Section 2.3 Inventory of discrete distributions of the No Bullshit Guide to Statistics.
Notebook setup
# Ensure required Python modules are installed
%pip install --quiet numpy scipy seaborn ministats
[notice] A new release of pip is available: 26.0.1 -> 26.2.1
[notice] To update, run: pip install --upgrade pip
Note: you may need to restart the kernel to use updated packages.
# Load Python modules
import numpy as np
import seaborn as sns
import matplotlib.pyplot as plt
from ministats import plot_pmf# Figures setup
plt.clf() # needed otherwise `sns.set_theme` doesn't work
sns.set_theme(
context="paper",
style="whitegrid",
palette="colorblind",
rc={"font.family": "serif",
"font.serif": ["Palatino", "DejaVu Serif", "serif"],
"figure.figsize": (6,2)},
)
%config InlineBackend.figure_format = "retina"<Figure size 640x480 with 0 Axes># Simple float __repr__
import numpy as np
if int(np.__version__.split(".")[0]) >= 2:
np.set_printoptions(legacy='1.25')
# set random seed for repeatability
np.random.seed(42)Discrete uniform distribution
from scipy.stats import randint

alpha = 1
beta = 4
rvR = randint(alpha, beta+1)
Note the +1 we added to the second argument.
rvR.mean()2.5rvR.var()1.25The limits of the sample space of the random variable rvR
can be obtained by calling its .support() method.
Probability mass function
plot_pmf(rvR, xlims=[0,8+1]);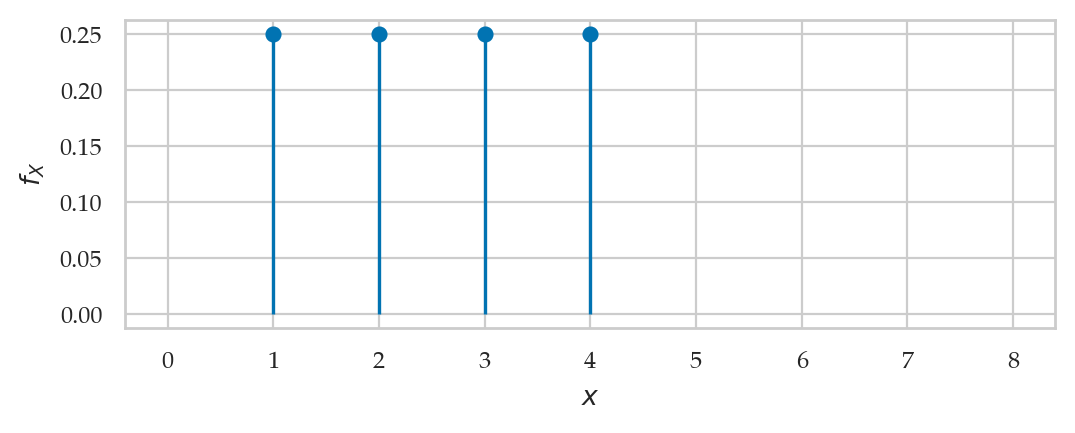
rvR.support()(1, 4)Bernoulli distribution
from scipy.stats import bernoulli

rvB = bernoulli(p=0.4)rvB.support()(0, 1)rvB.mean(), rvB.var()(0.4, 0.24)rvB.rvs(10)array([0, 1, 1, 0, 0, 0, 0, 1, 1, 1])plot_pmf(rvB, xlims=[0,5]);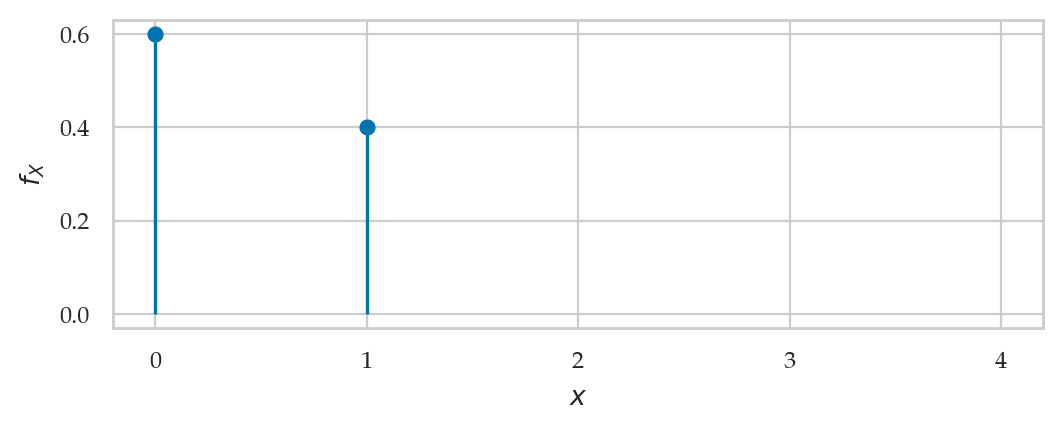
Mathematical interlude: counting combinations
Factorials
TODO explain + math formula
from scipy.special import factorial

factorial(4)24.0# # ALT.
# from math import factorial
# factorial(4)The factorial of 0 is defined as 1: .
factorial(0)1.0The factorial function grows grows very quickly:
[factorial(n) for n in [5, 6, 7, 8, 9, 10, 11, 12, 13]][120.0,
720.0,
5040.0,
40320.0,
362880.0,
3628800.0,
39916800.0,
479001600.0,
6227020800.0]Combinations
TODO explain + math formula
from scipy.special import comb

comb(5, 2)10.0from itertools import combinations
list(combinations({1,2,3,4,5}, 2))[(1, 2),
(1, 3),
(1, 4),
(1, 5),
(2, 3),
(2, 4),
(2, 5),
(3, 4),
(3, 5),
(4, 5)]Exercises
from scipy.special import comb

comb(12,6)924.0from scipy.special import comb
comb(52,5)2598960.0Links
Binomial distribution
We’ll use the name rvX because rvB was already used for the Bernoulli random variable above.
from scipy.stats import binom

n = 20
p = 0.14
rvX = binom(n,p)rvX.support()(0, 20)rvX.mean(), rvX.var()(2.8000000000000003, 2.4080000000000004)plot_pmf(rvX, xlims=[0,21]);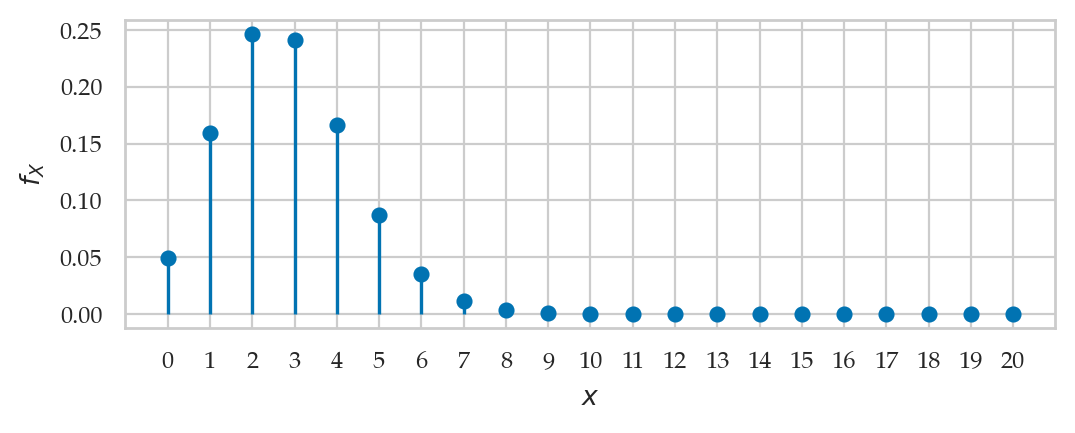
Poisson distribution
from scipy.stats import poisson
lam = 10
rvP = poisson(lam)rvP.pmf(8)0.11259903214902009rvP.cdf(8)0.3328196787507191## ALT. way to compute the value F_P(8) =
# sum([rvP.pmf(x) for x in range(0,8+1)])plot_pmf(rvP, xlims=[0,30]);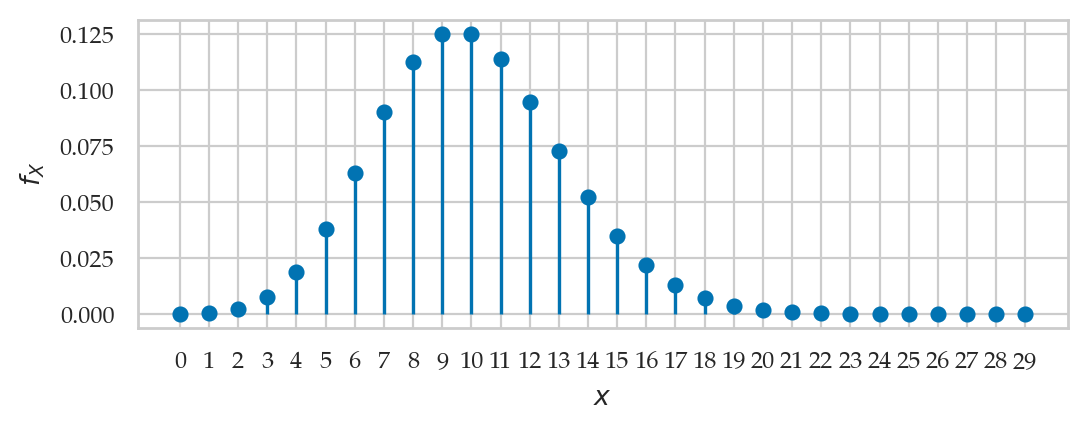
Geometric distribution
from scipy.stats import geom

rvG = geom(p = 0.2)rvG.support()(1, inf)rvG.mean(), rvG.var()(5.0, 20.0)plot_pmf(rvG, xlims=[0,30+1]);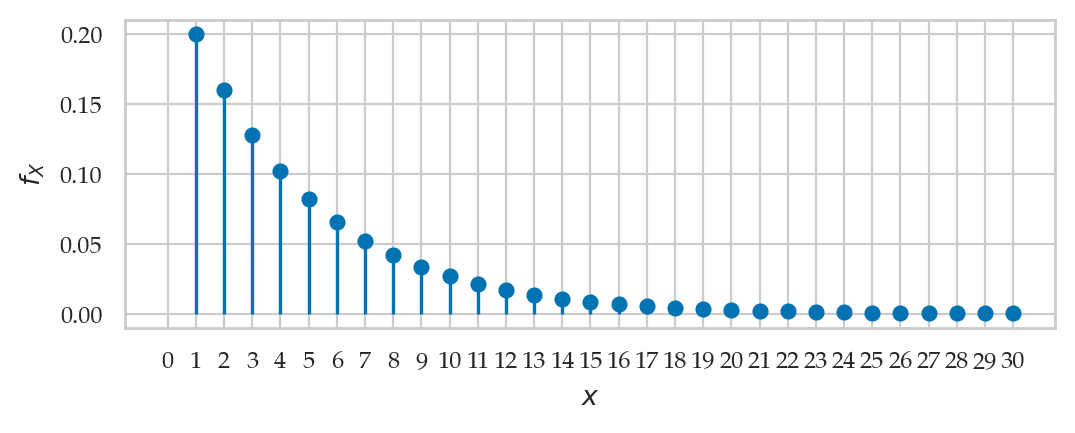
Negative binomial distribution
from scipy.stats import nbinom

r = 5
p = 0.5
rvNB = nbinom(r, p, loc=r)rvNB.support()(5, inf)rvNB.mean(), rvNB.var()(10.0, 10.0)plot_pmf(rvNB, xlims=[0,30+1]);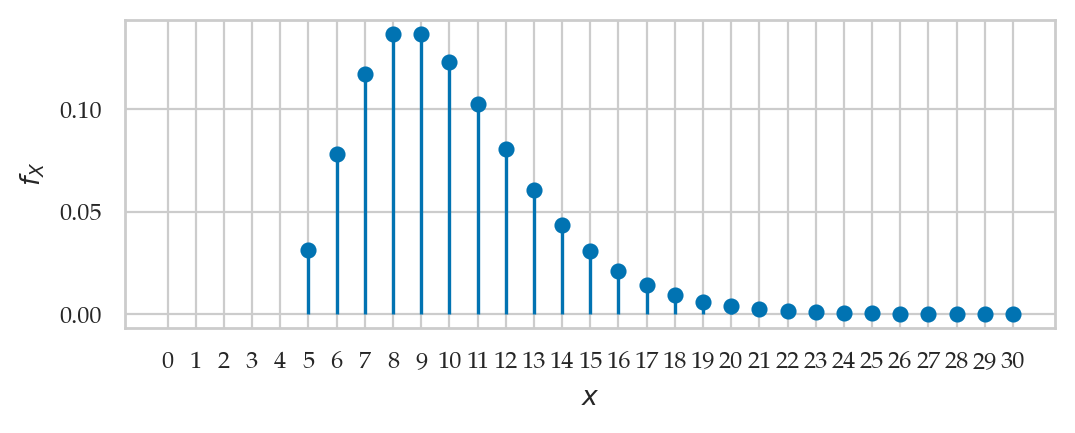
Building computer models for random variables
# import the model family
from scipy.stats import randint

# choose parameters
alpha = 1  # start at 1
beta = 4   # stop at 4

# create the rv object
rvR = randint(alpha, beta+1)
Note the +1 we added to the second argument.
rvR.mean()2.5# verify using formula
(alpha + beta) / 22.5rvR.var()1.25# verify using formula
((beta + 1 - alpha)**2 - 1) / 121.25rvR.std()1.118033988749895The limits of the sample space of the random variable rvR
can be obtained by calling its .support() method.
rvR.support()(1, 4)Probability calculations
rvR.pmf(1) + rvR.pmf(2) + rvR.pmf(3)0.75[rvR.pmf(r) for r in range(1,3+1)][0.25, 0.25, 0.25]sum([rvR.pmf(r) for r in range(1,3+1)])0.75rvR.cdf(3)0.75Plotting distributions
Probability mass function
To create a stem-plot of the probability mass function , we can use the following three-step procedure:
Create a range of inputs
rsfor the plot.Compute the value of
rvRfor each of the inputs and store the results as list of valuesfRs.Plot the values
fRsby calling the functionplt.stem(rs, fRs).
import matplotlib.pyplot as plt

rs = range(0, 8+1)
fRs = rvR.pmf(rs)
fRs = np.where(fRs == 0, np.nan, fRs)  # set zero fRs to np.nan
plt.stem(rs, fRs, basefmt=" ");
plt.xlabel("$r$")
plt.ylabel("$f_R$")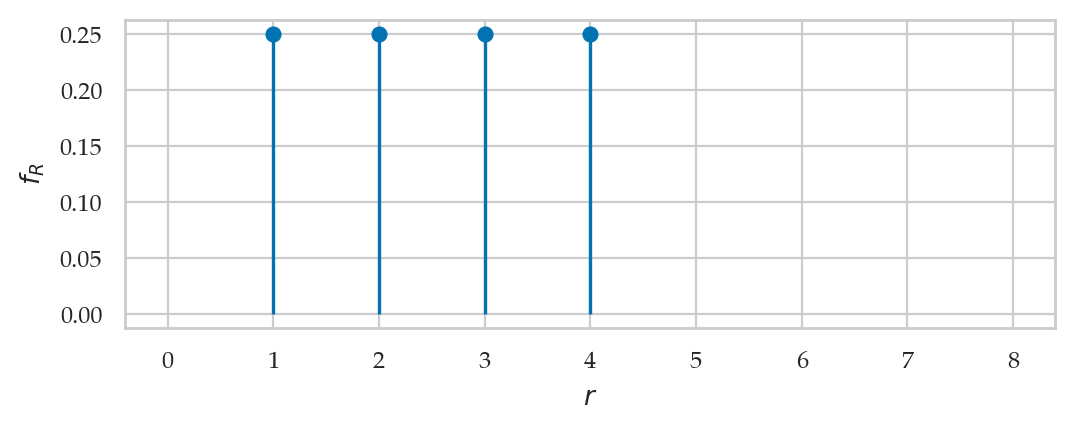
Note, we used the np.where statement
to replace zero entries in the list fRs
to the special Not a Number (np.nan) values,
which excludes them from the plot.
This is arguably a cleaner representation of the PMF plot:
the function is only defined for the sample space .
An alternative ,,,
# ALT. using helper function
from ministats import plot_pmf

plot_pmf(rvR, xlims=[0,8+1], rv_name="R");
# Uncomment and run this to see the `plot_pmf` source code
# %psource plot_pmfCumulative distribution function
import numpy as np
import seaborn as sns

bs = np.linspace(0, 8, 1000)
FRs = rvR.cdf(bs)
sns.lineplot(x=bs, y=FRs);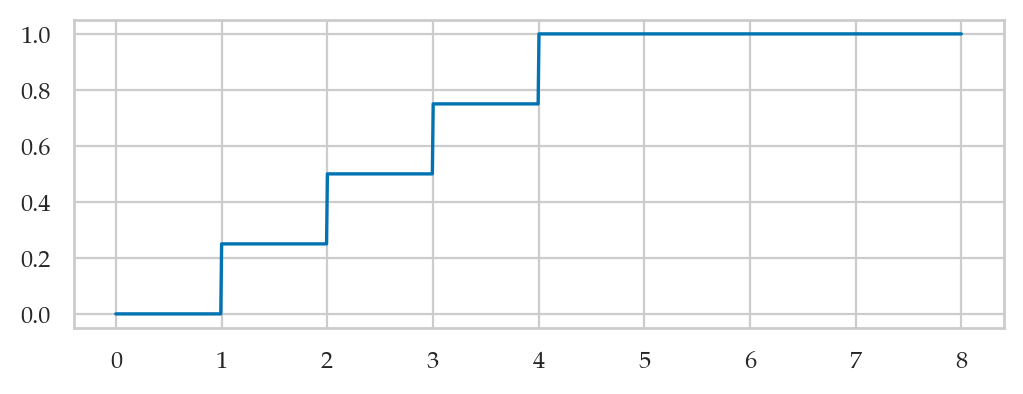
# ALT. using helper function
from ministats import plot_cdf

plot_cdf(rvR, xlims=[0,8], rv_name="R");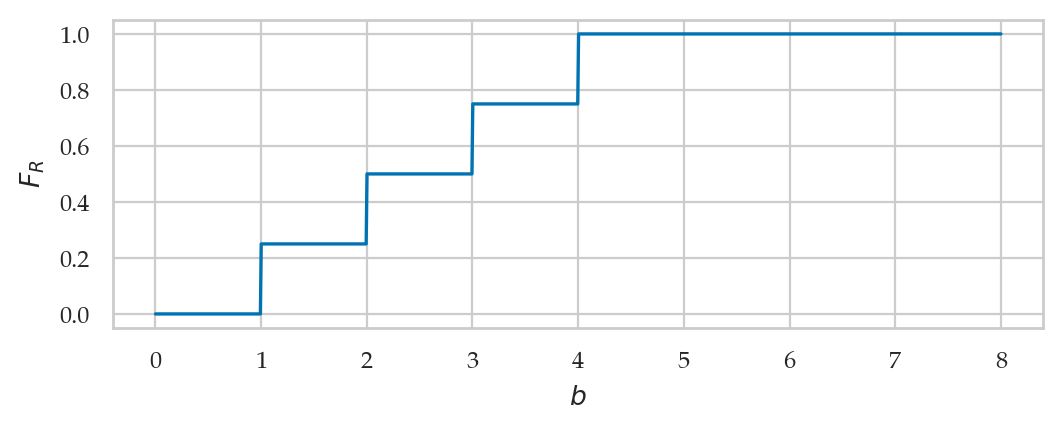
Generating random observations
Let’s generate 10 random observations from random variable rvR:
np.random.seed(43)

rvR.rvs(10)
array([1, 1, 4, 2, 2, 3, 1, 4, 2, 4])Explanations
Binomial coefficient formula explained
n = 6
[int(comb(n,k)) for k in range(0,n+1)]
[1, 6, 15, 20, 15, 6, 1]We can draw Pascal’s triangle
by by repeating the above calculation for several values of n.
for n in range(0,10):
    row_ints = [int(comb(n,k)) for k in range(0,n+1)]
    row_str = str(row_ints)
    row_str = row_str.replace("[","").replace("]","").replace(",", "  ")
    row_str = row_str.center(60)
    print(row_str)
1
1 1
1 2 1
1 3 3 1
1 4 6 4 1
1 5 10 10 5 1
1 6 15 20 15 6 1
1 7 21 35 35 21 7 1
1 8 28 56 70 56 28 8 1
1 9 36 84 126 126 84 36 9 1
Geometric sums
r = 0.3
sum([r**n for n in range(0,100)])1.42857142857142861 / (1 - r)1.4285714285714286Discussion
Relations between distributions
Exercises
Exercise XX
from scipy.stats import poisson
lam = 20
rvH = poisson(lam)
# a) Pr(H in {20,21,22})
rvH.pmf(20) + rvH.pmf(21) + rvH.pmf(22)0.2503540762867841# b) Pr({16≤H≤24})
rvH.cdf(24) - rvH.cdf(16-1)0.6867142435340193# c) F_H^{-1}(0.95)
rvH.ppf(0.95)28.0