Using Python for learning statistics Part 1#
This Juppyter notebook contains the code examples form the blog post Python coding skills for statistics Part 1.
I’ve intentionally left empty code cells throughout the notebook, which you can use to try some Python commands on your own. For example, you can copy-paste some of the commands in previous cells, modify them and run to see what happens. Try to break things, that’s the best way to learn!
To run a code cell, press the play button in the menu bar, or use the keyboard shortcut SHIFT+ENTER.
What can python do for you?#
Using Python as a calculator#
2.1 + 3.4
5.5
num1 = 2.1
num2 = 3.4
num1 + num2
5.5
Let’s now compute the avarage of the numbers num1 and num2.
(num1 + num2) / 2
2.75
Powerful primitives and builtin functions#
grades = [80, 90, 70, 60]
avg = sum(grades) / len(grades)
avg
75.0
For loops#
total = 0
for grade in grades:
    total = total + grade
avg = total / len(grades)
avg
75.0
Functions#
Python functions are …
To define the Python function,
we use the def keyword followed by the function name,
then we then specify the function input in parentheses,
and end with the symbol :,
which tells us “body” of the function is about to start.
The function body is a four-spaces-indented code block that specifies all the
calculations the function performs,
and ends with a return statement for the output of the function.
def <fname>(<input>):
    <fcalc 1>
    <fcalc 2>
    <fcalc ...>
    return <output>
Example 1: sample mean#
We want to define a Python function mean that computes the mean from a given sample (a list of values).
The mathematical definition of the mean is \(\mathbf{Mean}(\mathbf{x}) = \frac{1}{n} \sum_{i=1}^{i=n} x_i\), where \(\mathbf{x} = [x_1, x_2, x_3, \ldots, x_n]\) is a sample of size \(n\) (a list of values).
The code for the function is as follows:
def mean(values):
    total = 0
    for value in values:
        total = total + value
    avg = total / len(values)
    return avg
To call the function mean with input grades, we use the Python code mean(grades).
grades = [80, 90, 70, 60]
mean(grades)
75.0
Exmample 2: math function (bonus topic)#
In math, a function is a mapping from input values (usually denoted x) to output values (usually denoted y). Consider the mapping that doubles the input and adds five to it, which we can express as the math function \(f(x) = 2x+5\). For any input \(x\), the output of the function \(f\) is denoted \(f(x)\) and is equal to \(2x+5\). For example, \(f(3)\) describes the output of the function when the input is \(x=3\), and it is equal to \(2(3)+5 = 6 + 5 = 11\). The Python equivalent of the math function \(f(x) = 2x+5\) is shown below.
def f(x):
    y = 2*x + 5
    return y
To call the function f with input x, we simply writhe f(x) in Python,
which is the same as the math notation we use for “evaluate the function at the value x.”
f(3)
11
Why do you need coding for statistics?#
Data visualization#
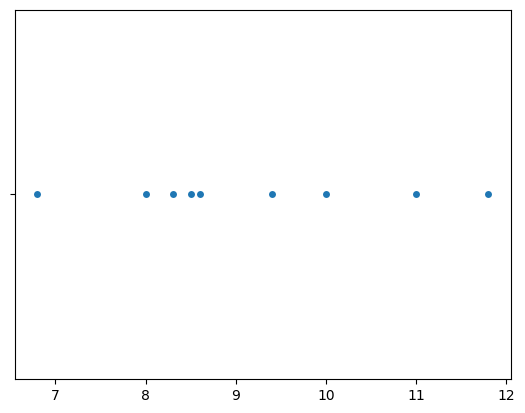
prices = [11.8, 10, 11, 8.6, 8.3, 9.4, 8, 6.8, 8.5]
import seaborn as sns
sns.stripplot(x=prices, jitter=0)
<Axes: >
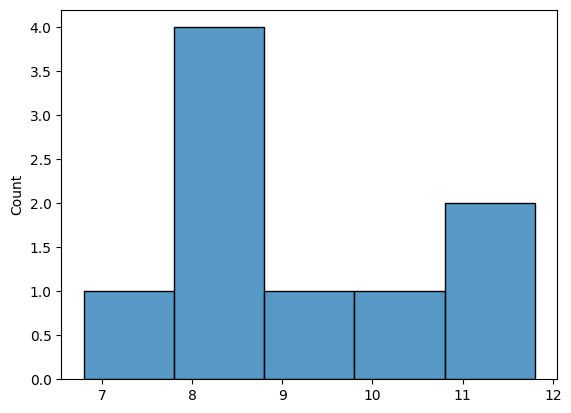
sns.histplot(x=prices);
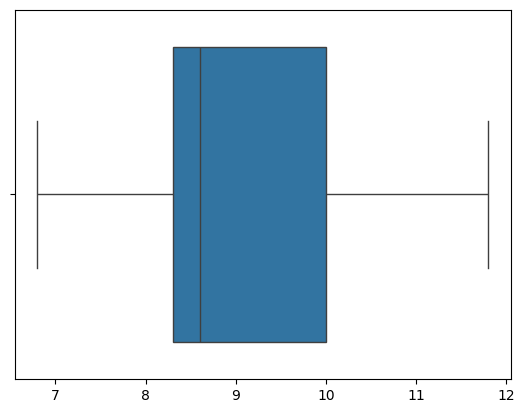
sns.boxplot(x=prices);
Descriptive statistics#
Data manipulations using Pandas#
import pandas as pd
epriceswide = pd.read_csv("https://nobsstats.com/datasets/raw/epriceswide.csv")
print(epriceswide)
   East  West
0   7.7  11.8
1   5.9  10.0
2   7.0  11.0
3   4.8   8.6
4   6.3   8.3
5   6.3   9.4
6   5.5   8.0
7   5.4   6.8
8   6.5   8.5
type(epriceswide)
pandas.DataFrame
We want to extract only the second column which is called “West”:
pricesW = epriceswide["West"]
pricesW
0    11.8
1    10.0
2    11.0
3     8.6
4     8.3
5     9.4
6     8.0
7     6.8
8     8.5
Name: West, dtype: float64
type(pricesW)
pandas.Series
# # ALT. we can input data by specifying lists of values
# pricesW = pd.Series([11.8,10,11,8.6,8.3,9.4,8,6.8,8.5])
Descriptive statistics using pandas#
pricesW.count()
np.int64(9)
pricesW.mean()
np.float64(9.155555555555557)
pricesW.median()
np.float64(8.6)
pricesW.std()
np.float64(1.5621388471508475)
pricesW.describe()
count     9.000000
mean      9.155556
std       1.562139
min       6.800000
25%       8.300000
50%       8.600000
75%      10.000000
max      11.800000
Name: West, dtype: float64
Data cleaning#
How much Python do you need to know?#
I remind you the key aspect is to learn how to use Python as a calculator.
I talked about the for-loops and function definitions only to make sure you can read Python code,
but you don’t need to write any such code to learn statistics.
As long as you know how to call functions and run code cells in a notebook,
then you’ll still benefit from all the educational power that Python has to offer.
Conclusion#
Python = good for your life!
Links#
Book website noBSstats.com: contains all the notebooks, demos, and visualizations from the book.
Detailed book outline: continuously updated list of the topics that are covered in each section
Python tutorial: introduction to Python syntax, data types, functions and other constructs. See also the Pandas tutorial (WIP) and the Seaborn tutorial (WIP).
Previous blog posts about statistics book:
Python coding skills for statistics - PART 2: probability and statistics procedures
PART 3: coming soon
Python error messages#
3/0
---------------------------------------------------------------------------
ZeroDivisionError                         Traceback (most recent call last)
Cell In[26], line 1
----> 1 3/0

ZeroDivisionError: division by zero