Statistics overview#
This series of notebooks and video tutorials presents a complete example of a statistical analysis that touches all major topics described in the upcoming book No Bullshit Guide to Statistics. We’ll illustrate key statistics concepts using hands-on code demonstrations in Python.
Click on the video thumbnails to watch the video walkthroughs on youtube and use binder links like this one ![]() to play with the notebooks interactively. Click here for see the complete playlist.
to play with the notebooks interactively. Click here for see the complete playlist.
Pro tip: If you find the narrative in the videos is too slow, you can change the playback speed to 1.25x or 1.5x. For more fine-grained control of playback speed, I highly recommend the Video Speed Controller plugin for Chrome.
Introduction and 01 DATA#
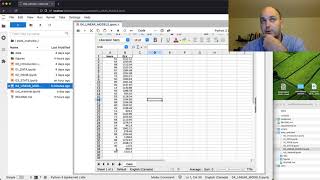
In this video, we’ll introduce the running example we’ll use for the whole video series: Amy’s experiment about providing additional training to her startup employees. In the second half of the video, we’ll illustrate concepts from chapter 01 DATA like extracting data from a spreadsheet, transforming data from “wide” to “tall” format, and viewing descriptive statistics like histograms, box plots, strip plots, and numerical summaries.
Introduction Notebook: ![]()
![]()
01 DATA Notebook: ![]()
![]()
02 PROB - Probability theory#
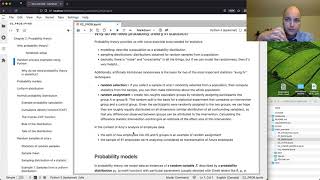
This video introduces some fundamental topics from probability theory like random events, random variables, and probabilistic models. Understanding probability theory allows us to build mathematical models for the variability in data we observe, and we’re lucky to have the lego pieces in scipy.stats at our disposal. Using the code from scipy.stats we can model most common random variables, generate random samples, do calculations using the probability functions and their inverses, etc.
The second half of the video is concerned with that probability distribution for samples of size n from a probability distribution. We study the properties of certain statistics (quantities computed from a sample) and learn about the Central Limit Theorem which tells us some useful facts about the distribution of the sample mean (usually denoted as overline-x) from any distribution.
Notebook: ![]()
![]()
03 STATS - Inferential statistics#
In the third notebook, we finally get to work on two fundamental questions of inferential statistics: (1) hypothesis testing and (2) estimation. The statistics notebook contains multiple topics that require detailed explanations, so we’ve split the narrative into five separate videos. See the video links to the five parts below.
By the end of the statistical inference videos, we’ll have finally answered the Amy’s two research questions about the employee lifetime value (ELV) data:
Question 1 = Is there a difference between ELV of the two groups? → hypothesis testing
Question 2 = How much difference in ELV does stats training provide? → estimation
Part 1: Estimators#
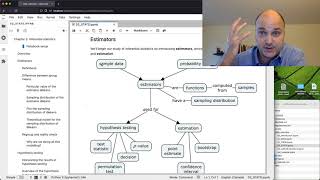
Estimators (functions 𝑓 computed from samples) are a fundamental tool for statistics. The descriptive statistics we saw in the DATA chapter are examples of estimators: the sample mean is an estimator for the population mean, and the sample variance is an estimator for the population variance. We denote by 𝑓(𝐱) value of the estimator computed from a particular sample 𝐱. We denote 𝑓(𝐗) the value of the estimator computed from a random sample 𝐗, and refer to the probability density function of 𝑓(𝐗) as the sampling distribution of the estimator 𝑓.
This video provides a detailed hands-on discussion about the difference-between-group-means estimator d = mean(xA) - mean(xB), which will is the math building block we’ll need for both hypothesis testing and estimation. We’ll obtain the sampling distribution for the difference-between-group-means estimator using both simulation and mathematical modelling techniques.
Notebook: ![]()
![]()
Part 2: Hypothesis testing intro#
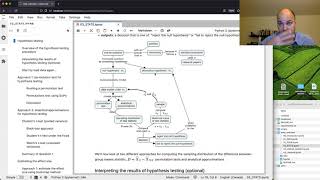
Hypothesis testing is an approach to formulating research questions in the form of yes-or-no decisions. Hypothesis testing is a standardized procedure for doing statistical analysis, and a common tool use din academic research papers. We formulate research question as two competing hypotheses:
H0, the null hypothesis, which is a baseline, skeptical claim like “no difference” or “zero effect”, and
HA, the alternative hypothesis, which usually embodies a theory or model that the researchers want to study.
In order to justify any study or analysis of the alternative hypothesis HA, scientific convention requires us to first “reject the null hypothesis,” which we can do if we can show that the observed data is very unlikely (less than 5% chance) to have occurred by chance under H0. The logic is if the data is unlikely to occur under H0, this lends support to HA and further study is warranted. The alternative is that we “fail to reject the null hypothesis,” which means the data observed is consistent with the “no difference” or “zero effect” data model, so does not require postulating any alternative hypothesis.
Notebook: see STATS notebook link above, starting at Hypothesis testing.
Part 3: Hypothesis testing using the permutation test#
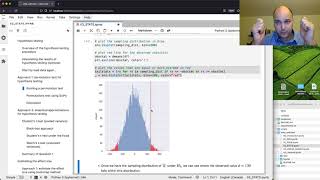
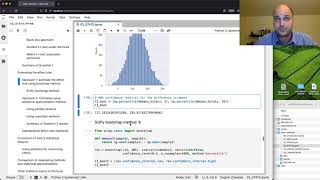
The permutation test allows us to obtain the sampling distribution under the null hypothesis H0 by using existing sample data and a clever “shuffling” of the group labels. Using this trick, we obtain the sampling distribution of the difference between group means according to the probability model for H0. We then find where the observed difference between group means d=130 falls within the sampling distribution to obtain the p-value. Since the p-value we obtain is less than 0.05 our conclusion is to reject the null hypothesis, i.e., we conclude that there is a statistically significant difference between the groups means.
Notebook: see STATS notebook link above, starting at Approach 1: Permutation test for hypothesis testing.
Part 4: Hypothesis testing using analytical approximations#
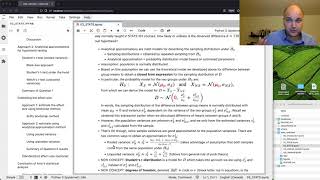
Analytical approximation methods in statistics provide ready-made formulas for describing the sampling distribution in various statistical analysis scenarios. These formulas are normally taught in STATS 101 courses because they require very few steps and can be applied without needing to understand the math models. For the specific scenario of comparison of two group means, we can use Student’s t-test (so called because it is based on Student’s t-distribution). This video shows how to apply Student’s t test to obtain the p-value 0.047 < 0.05 and reject the null hypothesis.
Notebook: see STATS notebook link above, starting at Approach 2: Analytical approximations for hypothesis testing.
Part 5: Effect size estimation#
In this video we’ll learn how to provide rigorous estimates of gains in ELV for employees that complete the stats training, which is called effect size in statistics. We’ll learn two different ways of estimating the effect size: one based on resampling methods (bootstrap) and another based on analytical approximations and Student’s t-distribution. Both approaches give us a confidence interval, which describes the range of values for an effect size we can expect, and we can give a 90% guarantee on the procedure we use to generate the interval.
Notebook: see STATS notebook link above, starting at Estimating the effect size.
04 LINEAR MODELS#
Linear models allow us to describe relationships between two continuous quantities x and y. We assume the output Y is distributed according to Y ~ b+m*x, in other words the x-Y relationship is a line of the form y=mx+b. In this video we study the case when each employee receives a variable amount of stats training (anywhere from 0 hours to 100 hours), and the ELV value is modelled by the relationship ELV ∼ 𝛽0+𝛽1*hours, where 𝛽0 is the intercept and 𝛽1 is the slope. The notebook shows several different ways to fit the model (find the best choice of parameters 𝛽0 and 𝛽1), interpret the results, and make predictions.
Notebook: ![]()
![]()
Further reading#
The No Bullshit Guide to Statistics book outline
The statistics concept map
Read the blog posts about the statistics curriculum and the book proposal
Subscribe to the mailing list for progress updates on the book.
If you want to be involved in the writing process, you can sign up to become a noBSstats test reader. Every two weeks, you’ll receive a section draft and a link to the related notebook. The required time commitment is a few hours of reading, and a few minutes to send me an email highlighting any parts you found confusing, or if some explanations were missing. Your feedback and “user testing” on the draft chapters and notebooks will help me ship this faster!